
Figure 1.
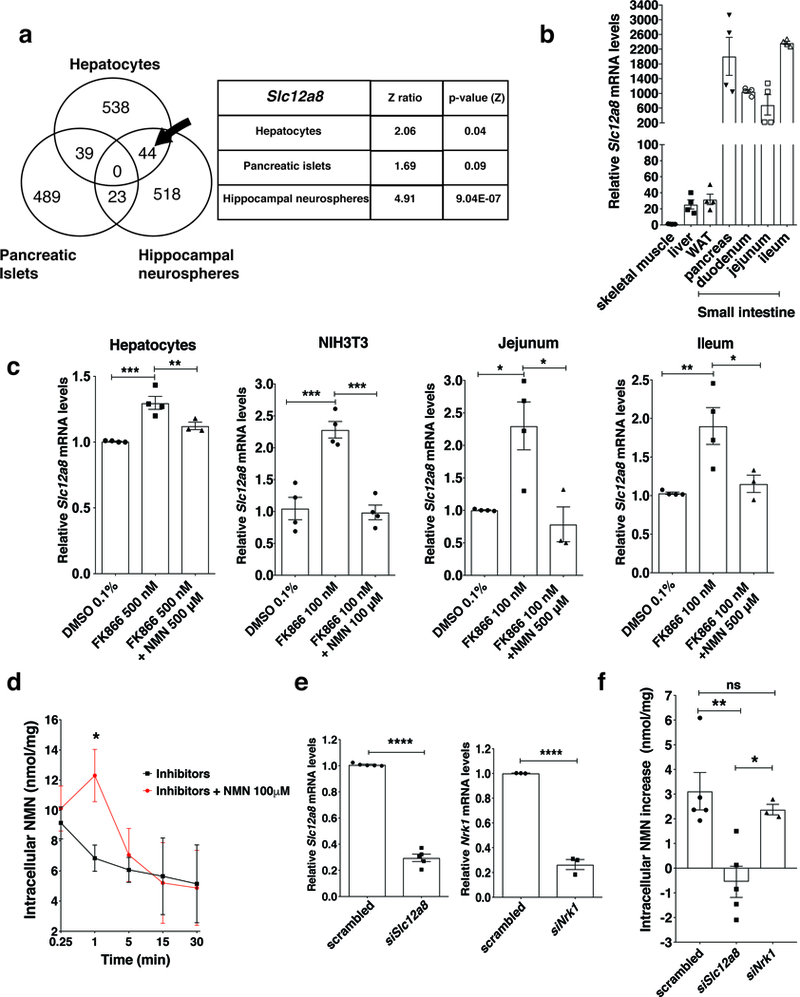
Identification and characterization of the Slc12a8 gene. a, Venn diagram of genes commonly upregulated in primary hepatocytes, pancreatic islets, and hippocampal neurospheres treated with FK866. Slc12a8 was identified in the section indicated by an arrow. Z ratios and two-sided p values for Slc12a8 in each cell type were calculated as described in the Methods section (n=4 biologically independent samples). b, Relative Slc12a8 mRNA levels in different tissues from B6 male mice at 3 months of age (n=4 mice). WAT, white adipose tissue. c, Relative Slc12a8 mRNA levels in primary mouse hepatocytes (n=4 mice, ** p=0.0191, ***p=0.0006), NIH3T3 fibroblasts (n=4 biologically independent samples, DMSO vs. FK866 ***p=0.0004, FK866 vs. FK866 plus NMN ***p=0.0003), and ex vivo explants of the jejunum and ileum (n=4 mice for DMSO and FK866 alone; n=3 mice for FK866 plus NMN; Jejunum, DMSO vs. FK866 *p=0.0168, FK866 vs. FK866+NMN *p=0.0111; Ileum, DMSO vs. FK866 **p=0.009, FK866 vs. FK866+NMN *p=0.0313) treated with 0.1% DMSO, FK866 alone or FK866 plus NMN (24h for cells, and 4 h for explants; analyzed using ANOVA with Tukey’s test). d, Time course of NMN uptake in mouse primary hepatocytes. Hepatocytes were pretreated with 500 nM FK866 for 24 h and then incubated with a cocktail of 20 μM dipyridamole, 500 μM AOPCP, and 500 nM FK866, with or without 100 μM NMN. NMN was measured by HPLC (n=4 mice, except for 3 data sets for 15 and 30 time points for inhibitors only; analyzed using ANOVA with Sidak’s test, *p=0.0262). e, Knockdown efficiencies of Slc12a8 and Nrk1 mRNA in mouse primary hepatocytes (n=5 mice for Slc12a8 silencing and n=3 for Nrk1 silencing; analyzed by unpaired two-sided t-test, siSlc12a8 ****p<0.0001, siNrk1 ****p<0.0001). f, Increases in intracellular NMN content measured by HPLC in primary hepatocytes treated with scrambled, Slc12a8, and Nrk1 siRNA at 1 min after addition of 100 μM NMN. Culture conditions were the same as described in d (n=5 mice for Slc12a8 silencing and n=3 for Nrk1 silencing; analyzed by ANOVA with Tukey’s test, **p=0.0052, *p=0.0413). All values are presented as mean ± SEM.