
Figure 2.
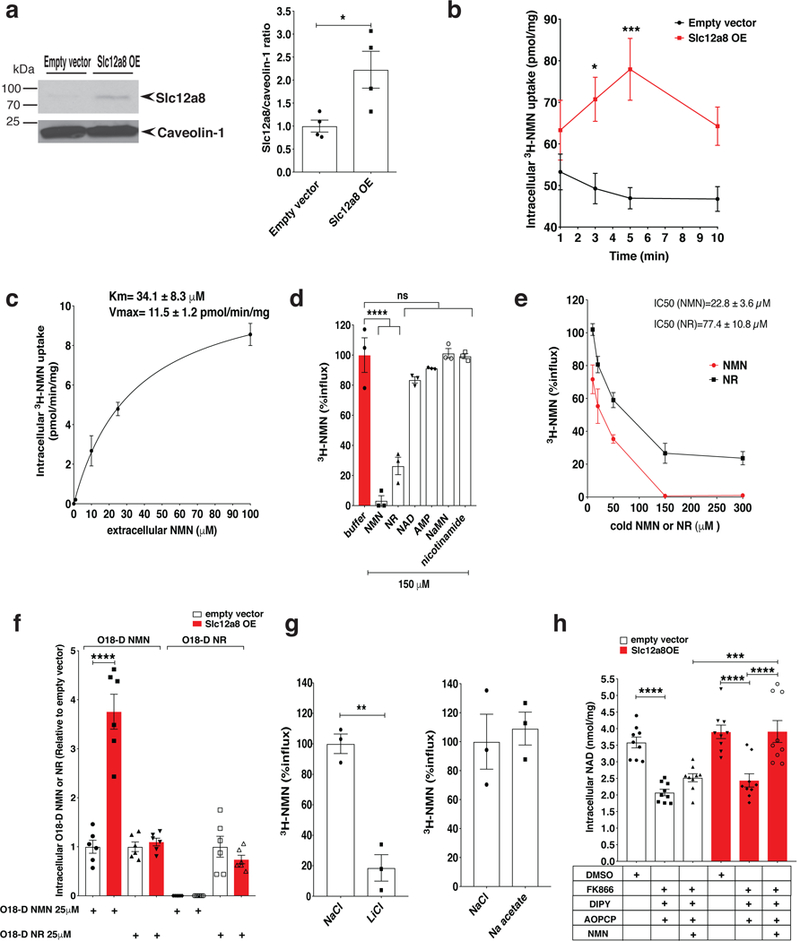
The kinetic features of the Slc12a8 NMN transporter and its specificity, sodium dependency, and effects on NAD+ biosynthesis. a, Slc12a8 protein expression in plasma membrane fractions from control and Slc12a8-OE NIH3T3 cells (left panel). Slc12a8 protein levels normalized to caveolin-1 protein levels are shown for each cell line (right panel; n=4 independent experiments; analyzed by unpaired two-sided t-test, *p=0.0271). b, Uptake of 3H-labeled NMN (3H-NMN; 25 μM, 37°C) in control and Slc12a8-OE NIH3T3 cells (n=12 biologically independent samples; analyzed by ANOVA with Sidak’s test, *p=0.0136, ***p=0.0001). c, Km and Vmax of Slc12a8 for NMN transport. Those values were determined by non-linear regression analysis by subtracting the backgrounds of control cells (n=5 biologically independent samples for 1 and 10 μM, and n=4 biologically independent samples for 25 and 100 μM). d, Substrate specificity of Slc12a8. Transport of 3H-NMN (150 nM, 25°C) into proteoliposomes derived from Slc12a8-OE cells was measured at 2 min in the presence of competing cold compounds (n=3 biologically independent samples, analyzed by ANOVA with Dunnett’s test, ****p=0.0001; ns, not significant). e, The half maximal inhibitory concentrations (IC50) of NMN and NR. Data are shown as percentages of 3H-NMN uptake (n=3 biologically independent samples; IC50 was calculated by non-linear regression analysis). f, Intracellular levels of doubly labeled, isotopic NMN (O18-D-NMN) and NR (O18-D-NR) were measured by mass spectrometry in control and Slc12a8-OE NIH3T3 cells incubated with 25 μM O18-D-NMN or O18-D-NR for 5 min (n=6 biologically independent samples; analyzed by unpaired two-sided t-test, ****p<0.0001). Values are expressed relative to O18-D-NMN or O18-D-NR levels detected in control NIH3T3 cells. g, Ion dependency of NMN uptake by Slc12a8. Sodium ion (Na+) or chloride ion (Cl-) was replaced with an equimolar concentration of lithium (Li+) or acetate, respectively (n=3 biologically independent samples, analyzed by unpaired two-sided t-test, **p=0.0017). h, Intracellular NAD+ content was measured as described in the Methods section (n=9 biologically independent samples; analyzed by ANOVA with Tukey’s test; control, DMSO vs inhibitors ****p<0.0001; Slc12a8-OE, DMSO vs. inhibitors ****p<0.0001, inhibitors vs. inhibitors+NMN ****p<0.0001; control, inhibitors+NMN vs. Slc12a8-OE, inhibitors+NMN ***p=0.0002). All values are presented as mean ± SEM.