
Figure 3.
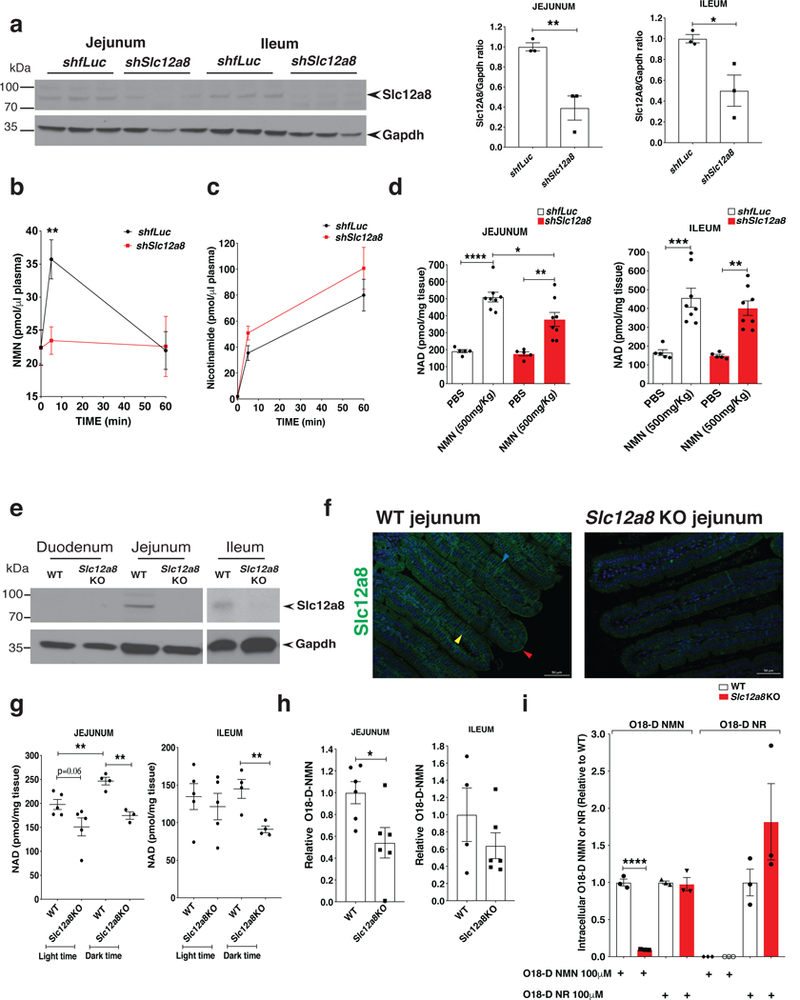
The in vivo knockdown (KD) of Slc12a8 in the small intestine. a, Slc12a8 protein levels in control and Slc12a8 KD jejunum and ileum samples. A representative Western blot is shown (left panel), and bar graphs show Slc12a8 protein levels normalized to Gapdh protein levels (right panel) (n=3 mice, repeated twice; B6 males at 3–4 months of age; analyzed by unpaired two-sided t-test, *p=0.0324, **p=0.0085). b, Plasma NMN levels after an oral gavage of NMN (500 mg/kg body weight) in control and Slc12a8 KD mice (n=6 mice; B6 males at 3–4 months of age; analyzed by ANOVA with Sidak’s test, **p=0.0080). c, Plasma nicotinamide levels in the same mice described in b (n=6 mice). d, Tissue NAD+ levels in the jejunum and ileum samples collected at 60 min time point after an oral gavage, as described in b (n=5 mice for PBS, and n=8 for NMN; B6 males at 3–4 months of age; analyzed by ANOVA with Tukey’s test; Jejunum, shfLuc PBS vs. NMN **** p<0.0001, shSlc12a8 PBS vs. NMN **p=0.0029, shfLuc NMN vs. shSlc12a8 NMN *p=0.0029; Ileum, shfLuc PBS vs. NMN ***p=0.0003, shSlc12a8 PBS vs. NMN **p=0.0030 ). e, Slc12a8 and Gapdh proteins in tissue lysates of the duodenum, jejunum, and ileum of Slc12a8KO mice and wild-type littermates (WT) (n=3 mice). f, Immunostaining of Slc12a8 (green) in the jejunum from 10 month-old Slc12a8KO female mice and WT littermates (n=3 mice). Red, blue, and yellow arrowheads indicate apical, lateral and basal membranes, respectively. Scale bars: 50 μm. g, Tissue NAD+ levels in the jejunum and ileum from Slc12a8KO mice and WT littermates, collected during light time (9–10 am) or during dark time (9–10 pm) (n=5 mice for the light time, and n=4 mice for the dark time, except for the 3 data points for the jejunum of Slc12a8KO mice; females at 8–10 months of age; analyzed by unpaired two-sided t-test; Jejunum, dark time WT vs. Slc12a8KO **p=0.0015, light time WT vs. dark time WT **p=0.0093; Ileum, dark time WT vs. Slc12a8KO **p=0.0069). h, Levels of doubly labeled, isotopic NMN (O18-D-NMN) in the jejunum and ileum by mass spectrometry at 10 min after orally administering 500 mg/kg of O18-D-NMN in Slc12a8KO mice and WT littermates (n=6 mice, 3 males and 3 females at 7–8 months of age, except for 2 males and 2 females for the wild-type ileum; analyzed by unpaired two-sided t-test, *p=0.0239). Values are expressed relative to O18-D-NMN levels detected in WT. i, Intracellular levels of O18-D-NMN and O18-D-NR by mass spectrometry in primary hepatocytes isolated from 5 month-old Slc12a8KO male mice and WT littermates and incubated with 100 μM O18-D-NMN or O18-D-NR for 5 min (n=3 mice; analyzed by unpaired two-sided t-test, ****p<0.0001). Values are expressed relative to O18-D-NMN or O18-D-NR levels detected in WT. All values are presented as mean ± SEM.