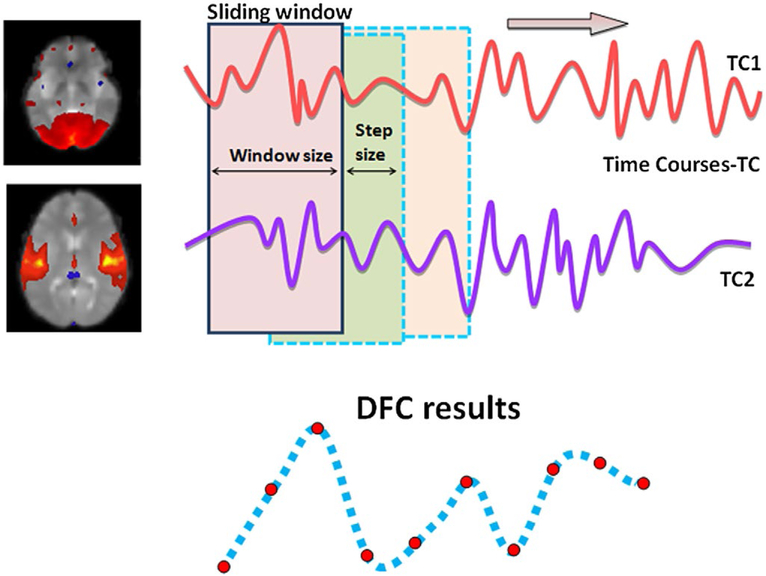
FIGURE 2.
Visualization of Dynamic Functional Connectivity (DFC) analysis on two brain regions (or two ICs, if ICA is employed). The two brain regions (ICs), each with their own fMRI time course, constitute a “pair”. For each pair, and for each time window, one DFC time point is obtained. By sliding the time window, the DFC time course for the pair is obtained

