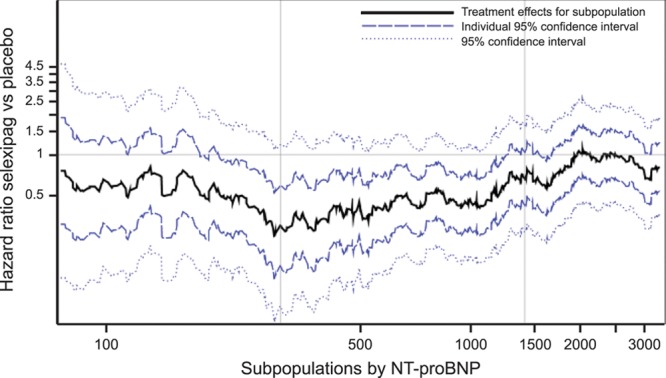
Figure 5.

Subpopulation treatment effect pattern plot showing the treatment effect of selexipag vs placebo on morbidity/mortality (hazard ratio plus 95% CIs and 95% confidence bands) by NT-proBNP (N-terminal pro brain natriuretic peptide) level at baseline. The black line indicates the hazard ratio of each subpopulation, the dark blue dashed line indicates the 95% CI for each individual subpopulation. The light blue dashed line shows the 95% confidence bands, which define the confidence interval of the best-fit line and indicate with 95% certainty the bounds within which the true curve will fall. Vertical lines indicate the 300 ng/L and 1400 ng/L NT-proBNP thresholds. HR indicates hazard ratio.
