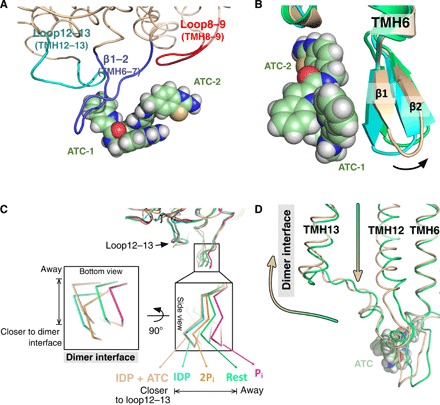
Fig. 3. Loop movement caused by the interactions with ATC.

(A) ATC dimer interaction with β1–2 strand (deep blue), loop8–9 (red), and loop12–13 (cyan). ATC is depicted in space-filling model (pale green, carbon; blue, nitrogen; red, oxygen: yellow, sulfur). (B) Superposition of TmPPase:IDP (cyan) with the TmPPase:IDP:ATC structure (wheat) and TmPPase:Ca:Mg (green) showing the large side movement of β1–2 strand (arrow). ATC is depicted as in (A). (C) Superposition of TmPPase structures in all different states showing the closer/away movement of β1–2 strand relative to the loop12–13 and the dimer interface of the protein. Coloring scheme from left to right: pink, phosphate analog (WO4)–bound state (TmPPase: WO4); green, resting state (TmPPase:Ca:Mg); orange, two-product–bound state (TmPPase:2Pi); cyan, IDP-bound state (TmPPase:IDP); wheat, IDP:ATC-bound state (TmPPase:IDP:ATC). (D) Superposition of TmPPase structures showing the downward movement of TMH12 and away movement of loop12–13 from the resting state (green) to the IDP:ATC-bound form (wheat) of TmPPase. The green-to-wheat colored arrow shows the movement.
