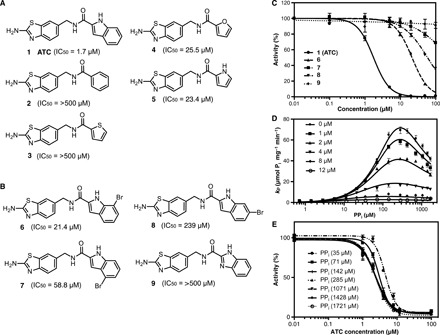
Fig. 4. Compound library and inhibition activity against TmPPase.

(A) Screening hits. (B) Analogs developed for structural studies. (C) Inhibition curve of ATC, compounds 6 to 9. (D) Kinetic inhibition plot for the inactivation of TmPPase at six different concentrations of ATC. The solid lines represent nonlinear regression fits with a residual SD (Sy.x) of 1.8. (E) Concentration-response curve of TmPPase at different ATC and substrate concentrations. The curves are the same for all concentrations of PPi greater than 100 μM (i.e., with significant amounts of the substrate bound) but differ at very low concentrations of the substrate. The enzymatic activity was related to the activity in the absence of the inhibitor (100%), and the background was measured from the signal in the absence of the enzyme. All data are shown as mean ± SD with n = 3 replicates.
