
Fig. 5. Long-lived IgE-producing plasma cells contribute to sustained serum IgE levels regardless of the maintenance of TFH cells in adult mice.
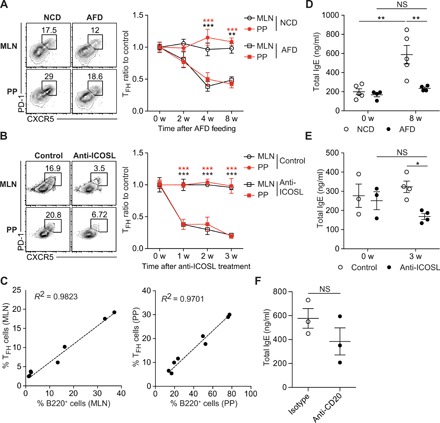
(A and D) GF mice (10 to 12 weeks old) were fed with NCD and AFD for 8 weeks (NCD versus AFD, n = 4 to 5). (A) Representative FACS plots showing PD-1hi CXCR5+ TFH cells gated on CD4+ TCRβ+ Foxp3− CD44hi cells in MLN and PP (left) and ratios of TFH cell frequency (right). (B and E) GF mice (12 weeks old) were untreated or treated with anti-ICOSL antibody every 3 days for 3 weeks (control versus anti-ICOSL, n = 4). (B) Representative FACS plots showing TFH cells in MLN and PP (left) and ratios of TFH cell frequency (right). (C) B cells in 10-week-old GF mice were gradually depleted by treating once with 0, 25, 100, and 250 μg of anti-CD20–depleting antibody (n = 2 per each dose). The correlation between the frequency of TFH cells and B220+ cells in MLN (left) and PP (right) was examined at 2 weeks after anti-CD20 antibody treatment. (D) Serum IgE levels in GF control (NCD, n = 5) and GF on AFD (AFD, n = 4) for indicated periods. (E) Serum IgE levels in GF untreated control (n = 3) and GF mice treated with anti-ICOSL antibody for indicated periods (n = 4). (F) GF mice (14 weeks old) were treated with isotype and anti-CD20 antibody (250 μg) every 3 days for 2 weeks. Serum IgE levels were shown. Each symbol represents an individual mouse. Data in (A) to (D) are pooled from two or three independent experiments. Data in (E) and (F) are representative of two independent experiments. Statistical differences were determined by two-way (A, B, D, and E) ANOVA with Tukey’s multiple comparisons test and by unpaired two-tailed Student’s t test (F). *P < 0.05, **P < 0.01, ***P < 0.001. NS, not significant. Error bars represent SEM.