
Fig. 6. Commensal microbiota suppresses IgE elevation by restraining food Ag–driven TFH cell generation.
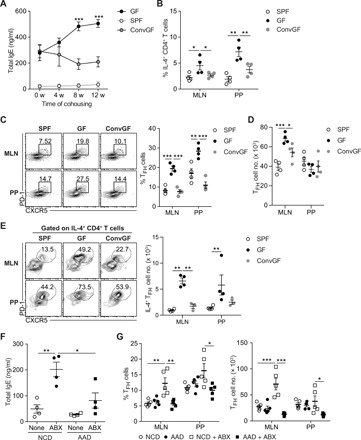
(A to C) GF mice (10 weeks old) were conventionalized by cohousing them with SPF mice for indicated periods (ConvGF). (A) Serum IgE levels in age-matched SPF, GF, and ConvGF mice at the indicated time point after conventionalization were measured by ELISA (n = 3). (B) Frequency of IL-4+ cells among CD44hi CD4+ T cells in MLN and PP from indicated mice at 8 weeks after conventionalization (n = 4). (C) Representative FACS plots of PD-1 and CXCR5 (left) and frequency of PD-1hi CXCR5+ TFH cells gated on CD4+ TCRβ+ Foxp3− CD44hi cells in MLN and PP from indicated mice (right) (n = 4). (D) Number of TFH cells in MLN and PP from indicated mice. (E) Representative FACS plots showing the frequency of PD-1hi CXCR5+ TFH cells gated on IL-4–producing CD4+ T cells (left) and number of IL-4–producing TFH cells (right). (F and G) SPF mice were weaned onto either NCD or AAD and were untreated or simultaneously treated with broad-spectrum ABX in drinking water for 6 weeks. (F) Serum IgE levels by ELISA (n = 4). (G) Frequency of PD-1hi CXCR5+ TFH cells gated on CD4+ TCRβ+ Foxp3− CD44hi cells (left) and number of TFH cells (right) in MLN and PP from indicated mice (n = 5). Each symbol represents an individual mouse. All data in (A) to (F) are representatives of two independent experiments, and data in (G) are pooled from two independent experiments. Statistical differences were determined by one-way (A to E and G) or two-way (F) ANOVA with Tukey’s multiple comparisons test. *P < 0.05, **P < 0.01, ***P < 0.001. Error bars represent SEM.