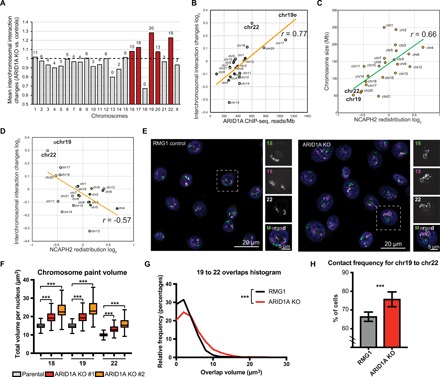
Fig. 6. ARID1A loss promotes intermixing of small chromosomes.

(A) Mean interchromosomal interaction changes across chromosomes. Number of chromosome pairs that showed significant [false discovery rate (FDR) < 5%] increase of interaction for each chromosome are indicated on the top of bars. Red bars highlight chromosomes with >50% significantly increased interchromosomal interactions. (B) Correlation between ARID1A ChIP-seq signal reads within significant peaks per megabase of chromosome length and changes in interchromosomal interaction. (C) NCAPH2 redistribution (relative change in number of NCAPH2 peaks in ARID1A knockout versus control RMG1 cells) across chromosomes. (D) Correlation between NCAPH2 redistribution and interchromosomal interactions. (E) Representative images of 3D chromosomal painting showing chr18 (green), chr19 (purple), and chr22 (white) in parental control and ARID1A knockout RMG1 cells. (F) Volumes of chr18, chr19, and chr22 (calculated on the basis of 3D chromosome painting from at least 790 nuclei) in parental control and two independent ARID1A knockout RMG1 clones. Error bars = mean with SD. (G and H) Distribution of 3D chromosome overlap area (G) or contact frequency (H) (from at least 747 nuclei) between chr19 and chr22 in parental control and ARID1A knockout RMG1 cells. Error bars = mean with SEM. P value was calculated by Mann-Whitney U test. Note that chr18 was excluded from the analysis in (B) to (D). Correlation was calculated by Pearson analysis. ***P < 0.001.
