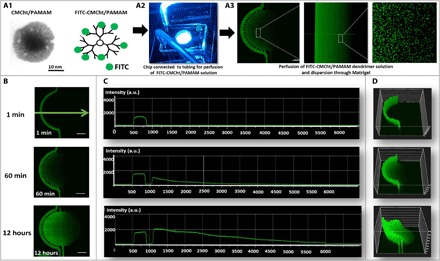
Fig. 3. Schematic representation of fluorescent nanoparticle gradient formation.

(A) Transmission electron microscopy image of individual CMCht/PAMAM dendrimer nanoparticle, representative image of chip connected to tubing perfusing the nanoparticle solution, and zoom-in confocal microscopy image confirming FITC-labeled CMCht/PAMAM dendrimer nanoparticles’ dispersion in Matrigel. (B) Panel of fluorescence microscopy images of FITC-labeled nanoparticle gradient up to 12 hours. (C) Quantification of fluorescence: Intensity [in arbitrary units (a.u.)] versus distance (in micrometers) across the chip up to 12 hours [measurements according to the direction of the green arrow indicated in (B)]. (D) 3D projection of FITC-labeled nanoparticle gradient according to fluorescence intensity.
