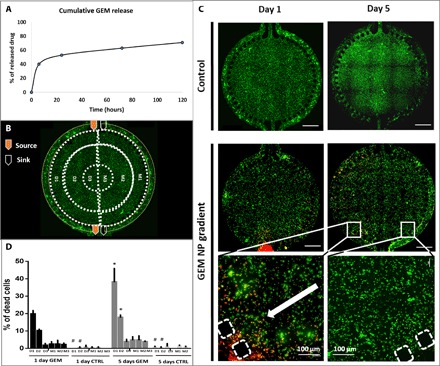
Fig. 4. GEM drug effect on colorectal tumor model.

(A) Release profile of GEM: Cumulative release (in hours) of GEM at pH 7.4 in phosphate-buffered saline (PBS), at 37°C and stirred at 60 rpm, determined by ultraviolet (UV) spectrophotometer set to 275 nm. The results are expressed as means ± SD (n = 6). (B) Schematic representation of experimental setup [perfusion of culture medium through one inlet and one outlet and of culture medium supplemented with GEM-loaded dendrimer nanoparticles (0.5 mg/ml) through the other inlet and outlet]; the areas defined for cell death quantification are delimited by dashed lines, and each ring is assigned D1 to D3 and M1 to M3. (C) Representative images of fluorescence microscopy images of live/dead assay performed on microfluidic chip at days 1 and 5. (D) Quantification of cell death, represented as percentage, based on the microscopy data. Data are presented as means ± SD (n = 3). The asterisk (*) denotes statistical differences (P < 0.05). Scale bars, 1000 μm. NP, nanoparticle; CTRL, control.
