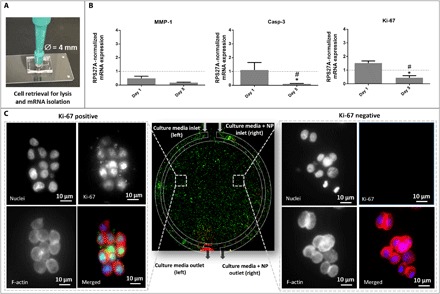
Fig. 5. Gene expression analysis and immunocytochemistry on a chip.

(A) Representation of hydrogel retrieval containing HCT-116 cells from the chip for gene expression analysis. (B) Gene expression of Ki-67, Casp-3, and MMP-1, in the absence (control) and presence of GEM, at days 1 and 5. The values for controls are represented by the dashed line. The asterisk (*) indicates significant differences when comparing the same condition at two different time points. The hash key (#) indicates significant differences when comparing to controls at the same time point. Data represent mean values of three independent experiments ± SD. RPS27A, ribosomal protein S27A. (C) Immunohistochemistry: In the center, a representative image of the entire chip is depicted. The lateral images represent the zoom in at the cell level showing the immunocytochemistry Ki-67 staining after 5 days in culture [panels showing DAPI nuclei staining (blue), Ki-67 staining (green), F-actin staining (red), and merged image in colors].
