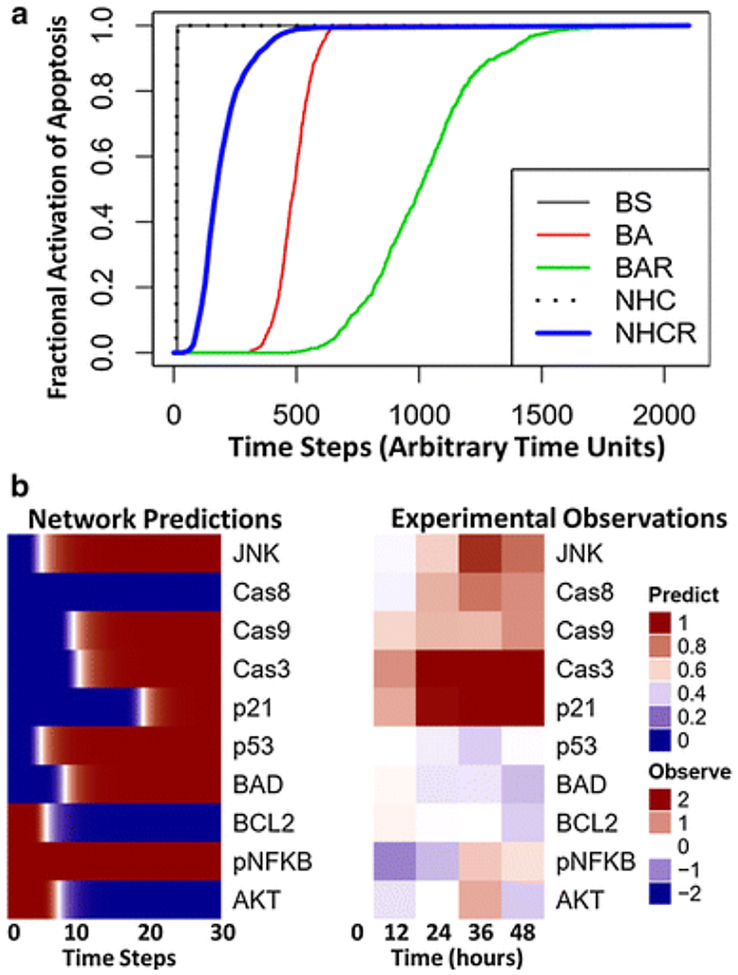
Fig. 3.
(a) Comparison of five Boolean network simulation methods. Simulations were performed for the effect of bortezomib (proteasome = OFF) on the Boolean network of signaling pathways in multiple myeloma [23]. The fractional activation of apoptosis is determined by dividing the frequency that apoptosis is activated by the total number of simulations (n=1000) across each time step: Synchronous (BS; black line), general asynchronous (BA; red line), random-order asynchronous (BAR; green line), normalized HillCube with default parameters (NHC; dotted line), and normalized HillCube with randomly sampled parameter values (NHCR; blue line). Default parameters values used for NHC simulations were: τ = 1, k = 0.5, and n = 3. Parameter values used for NHCR simulations were randomly generated from a Log-normal distribution with a mean (and standard deviation) of: τ = 1 (1), k = 0.5 (1), and n = 3 (1). (b) Boolean network normalized HillCube simulations compared with intracellular protein dynamics of U266 cells cultured with 3 nM bortezomib for 0, 12, 24, 36, and 48 hours. Data were obtained using a multiplex immunoassay (Luminex® MAGPIX®) and have been described in detail elsewhere [93].

