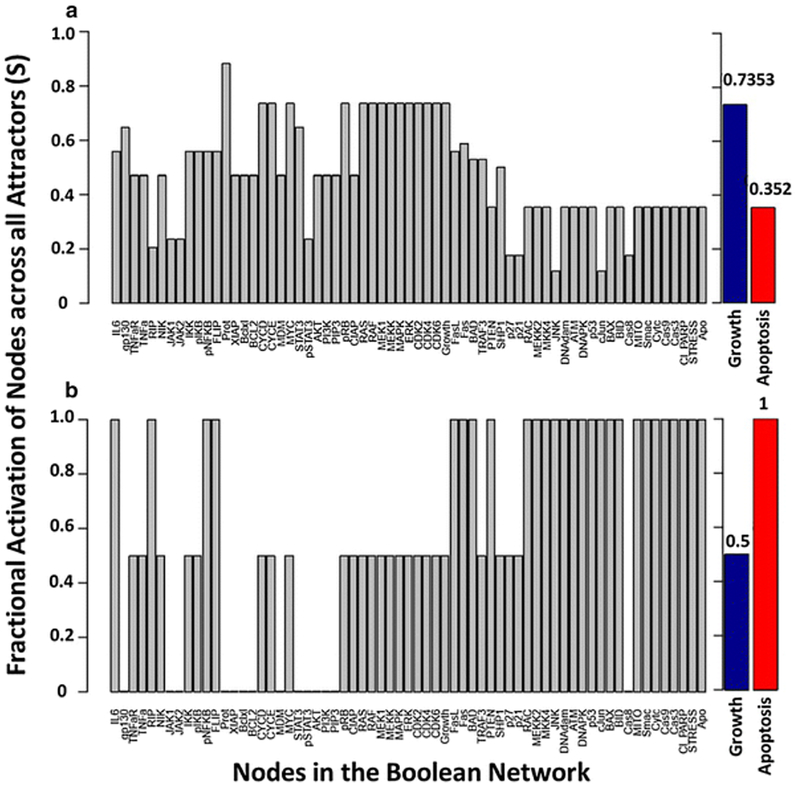
Fig. 6.
Attractor analysis with a set of random initial states (105) and general asynchronous updating for the multiple myeloma Boolean network [23] for the (a) absence and (b) presence of bortezomib. The y-axis represents the fractional activation of a node across all network attractors, and the x-axis represents all nodes in the Boolean network. The fractional activation of growth and apoptosis are represented as blue and red bars.

