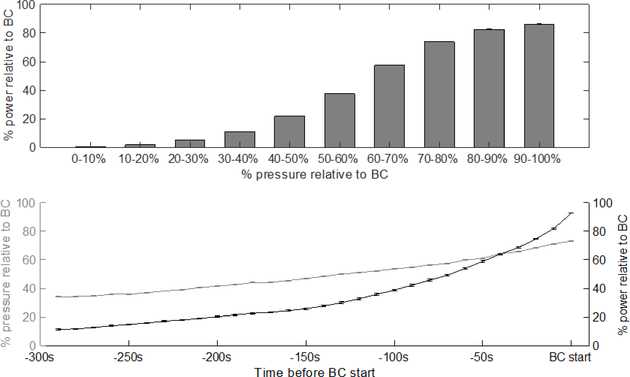
Fig. 11.
Top: Relationship between the bladder pressure and spectral power of the EUS EMG signal at times before the bladder contraction. Bottom: The pressure and spectral power as a function of time before the bladder contraction. Both the bladder pressure and spectral power are calculated as a percentage relative to their values at the bladder contraction (BC) start time. Values shown are the mean over all rats and post-PGE2 trials. Error bars denote standard error. The top panel shows that there is less than 30% spectral power present at bladder pressures less than 50% relative to BC. The bottom panel shows that bladder pressure and spectral power both increase monotonically before the BC start time.

