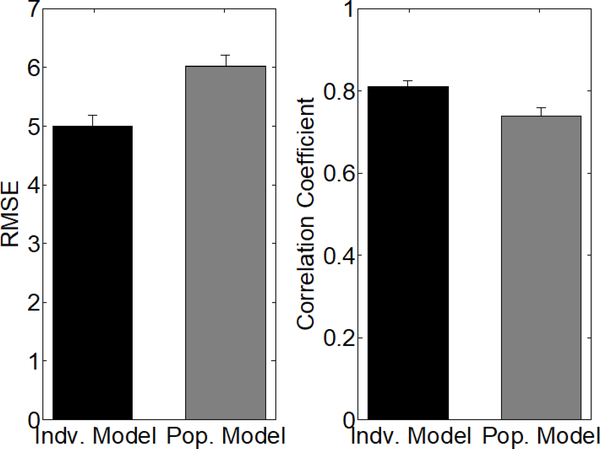
Fig. 13.
Accuracy metrics for predicting bladder pressure with an SP model trained on population level data. Error bars denote standard error. We trained 15 separate population SP models for predicting bladder pressure. In each of the SP models, we concatenated all of the post-PGE2 trial data from 14 rats and tested the model on the post-PGE2 trials from the remaining held-out rat. This essentially performs a leave-one-out cross validation analysis of our methodology, representing the best case scenario in which each SP model is trained on the maximum amount of data. The RMSE and correlation coefficient were used to compare the prediction accuracy of the individual level model (black) against the population level model (gray). RMSE and correlation coefficients are significantly worse for the population model (P < 0.005, Mann-Whitney U-test).

