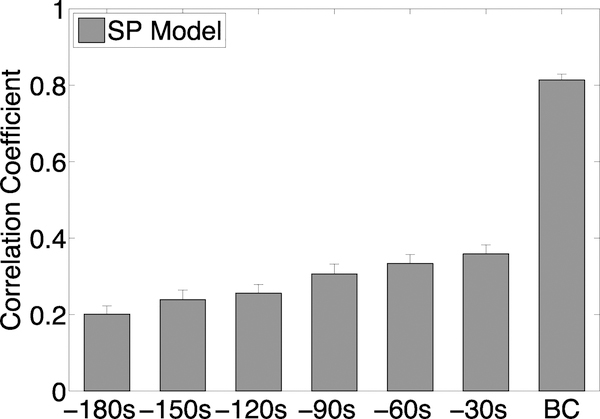
Fig. 4.
Correlation coefficients for out-of-sample test predictions for all rats on models trained on the first trial after PGE2 treatment. The x-axis labels indicate the time interval when predictions are made: “BC” = 60 second time window around the bladder contraction, “−30s” = the 30 second time interval just before the BC time interval, “−60s” = the 30 second time interval just before the “−30s” interval, etc...

