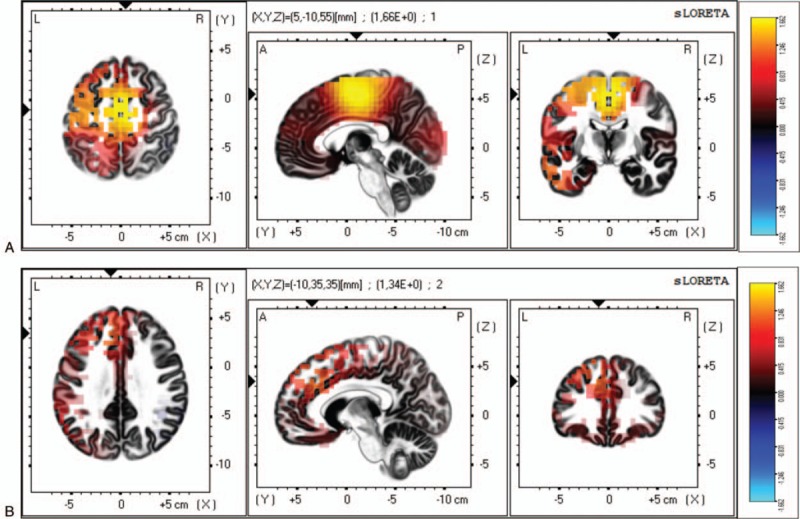
Figure 1.

Differences between patients with FM with depression and patients with FM without depression on the mean current source density analyzed by sLORETA. (A) For the delta frequency, the maximal difference across patients with FM appeared in the medial frontal gyrus (BA 6, MNI coordinates: x = 5, y = −10, z = 55). (B) For the theta frequency, the maximal difference across participant was detected in the medial frontal gyrus (BA 9, MNI coordinates: x = −10, y = −35, z = 35). The color bar shows sLORETA activation which represents the log-F-ratio value for each voxel.
