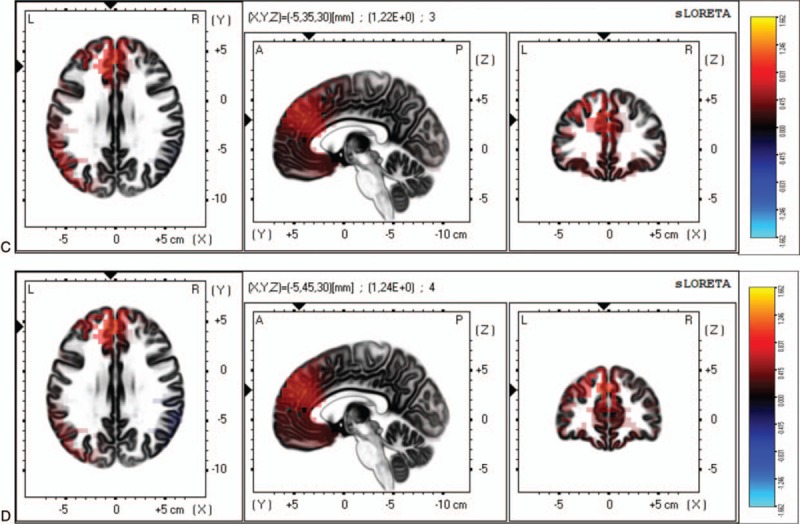
Figure 2.

Differences between patients with FM with depression and patients with FM without depression on the mean current source density analyzed by sLORETA. (C) For the alpha-1 frequency, the maximal difference across patients with FM appeared in the cingulate gyrus (BA 32, MNI coordinates: x = −5, y = 35, z = 30). (D) For the alpha-2 frequency, the maximal difference across participant was detected in the medial frontal gyrus (BA 9, MNI coordinates: x = −5, y = −45, z = 30). The color bar shows sLORETA activation which represents the log-F-ratio value for each voxel.
