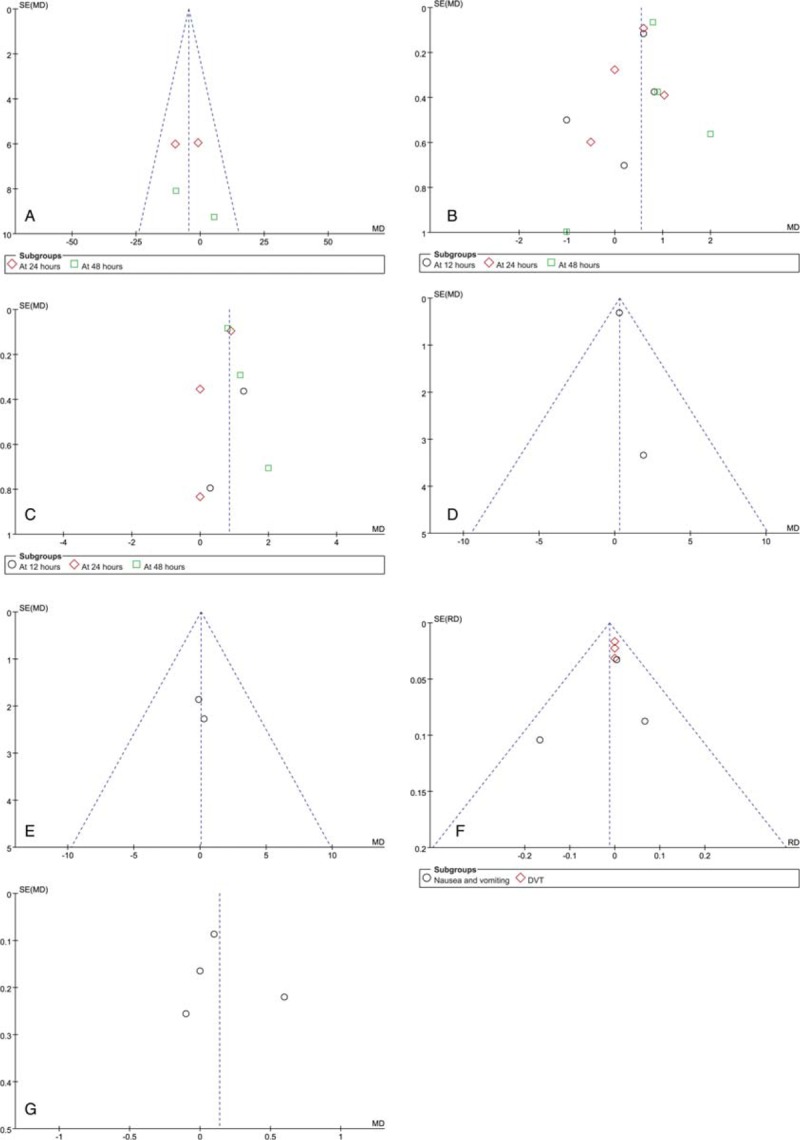
Figure 4.

(A) A funnel plot of morphine consumption (mg); (B) A funnel plot of VAS at rest; (C) A funnel plot of VAS at movement; (D) A funnel plot of time to first opioid request (hours); (E) A funnel plot of range of motion; (F) A funnel plot of Complications; (G) A funnel plot of LOS.
