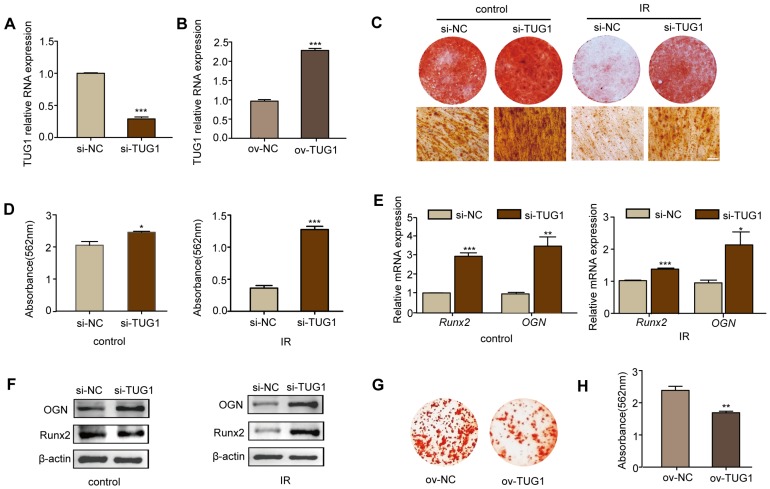
Figure 2.
TUG1 inhibits the osteogenic differentiation of BM-MSCs. (A-B) qRT-PCR analysis of RNA expression levels of TUG1 after BM-MSCs were transfected with TUG1-siRNA vector (si-TUG1), empty vector (si-NC) (A), TUG1-overexpression vectors (ov-TUG1) and empty CRISPR/CAS9 vectors (ov-NC) (B). (C-D) Representative images of alizarin red staining of alizarin red staining (C) with quantification of the dye extracted from alizarin red S staining (D) in osteogenesis.of BM-MSCs. Control: non-irradiated BM-MSCs; IR: irradiated BM-MSCs; Scale bars, 100 μm. (E-F) qRT-PCR analysis of mRNA expression (E) and western blot analysis of protein (F) levels of osteogenic markers in osteogenesis of BM-MSCs. (G-H) Representative images of alizarin red staining of alizarin red staining (G) with quantification of the dye extracted from alizarin red S staining (H) in osteogenesis.of ov-NC and ov-TUG1 BM-MSCs. All experiments were performed in triplicate, and the results are expressed as the means ±SEM. *P < 0.05; **P < 0.01; ***P < 0.001; ns: not significant. Abbreviations: IR: irradiated BM-MSCs; si-NC: BM-MSCs transfected with empty vector, si-TUG1: BM-MSCs transfected with TUG1-siRNA vector, ov-TUG1: BM-MSCs transfected with TUG1-overexpression vectors, ov-NC: BM-MSCs transfected with empty CRISPR/CAS9 vectors.

