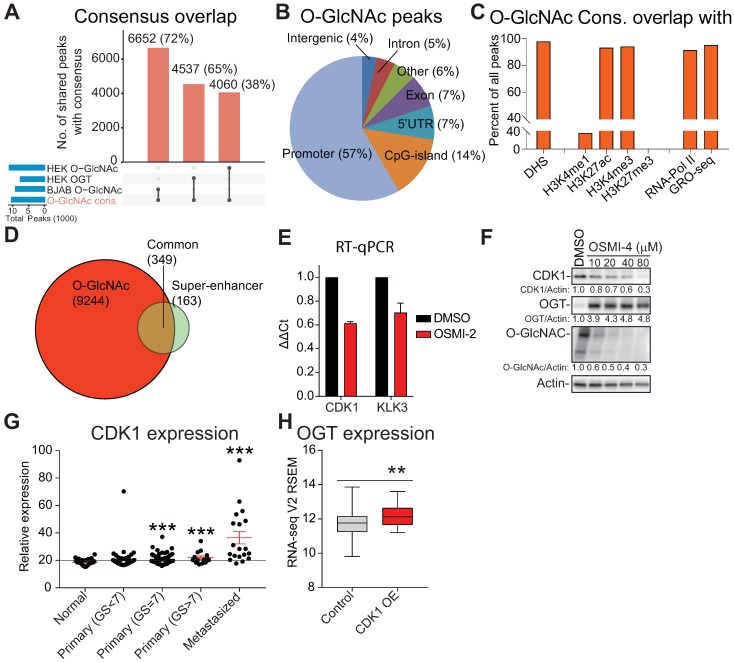
Figure 2.
O-GlcNAc chromatin mark overlaps with active promoters and super-enhancers. A) UpSet plot shows the overlap of O-GlcNAc consensus peak-set (10,463) with previously reported OGT and O-GlcNAc ChIP-seq datasets (BJAB O-GlcNAc [GSM2295951], HEK OGT [GSE36620], and HEK O-GlcNAc [GSE36620]. B) Peak distribution of O-GlcNAc ChIP-seq data reported here with respect to known genomic elements. C) O-GlcNAc consensus overlap with previously published datasets. Accession numbers to published datasets: DNase I hypersensitive site (DHS): GSM816637, H3K4me1: GSE73994, H3K27ac: GSE73994, H3K4me3: GSE73994, H3K27me3: GSE73994, RNA-Pol II: GSE28126 and Global Run-On Sequencing (GRO-seq); retrieved from Wang et al., 2011 and analyzed according to Chae et al., 2015) 73, 74. D) Overlap of LNCaP O-GlcNAc ChIP-seq marked genes with LNCaP super-enhancers as reported previously 47. E) The effect of 40µM OSMI-2 (24 hours) on CDK1 and KLK3 mRNA expression. The data shown is an average of three biological replicates with SEM. F) The effect of OSMI-4 (24 hours) on CDK1 expression at the protein level. Densitometry was used to determine the intensity of the indicated proteins. G) Expression of the CDK1 gene in prostate cancer patient samples. Data was downloaded from http://www.betastasis.com/prostate_cancer/taylor_et_al_2010. The mean values with SEM are shown for each group. The significance of the data was evaluated using Student's t-test in comparison to normal samples, ***<0.001. H) Expression of OGT in prostate cancer tumor samples that overexpress CDK1 (n=19) and the rest (n=479). The figure was generated using data available through cBioPortal 75, 76.

