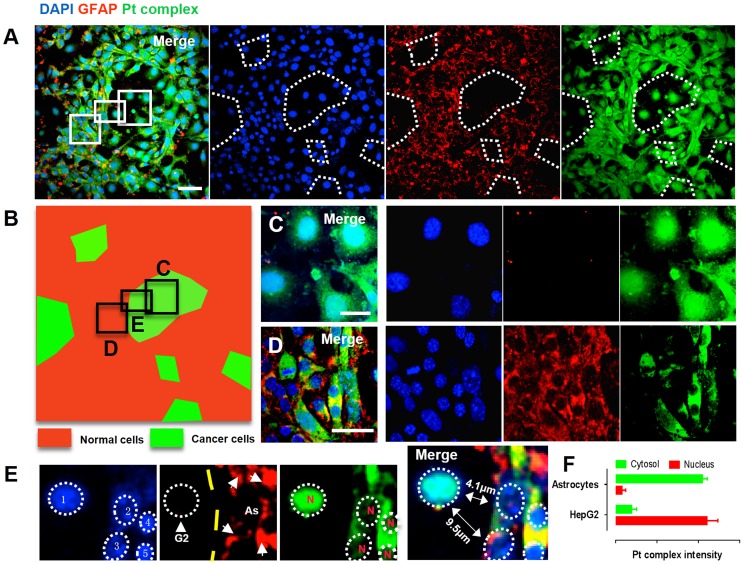
Figure 5.
(A) Confocal imaging of co-cultured normal cells (HepG2 cells) and cancer cells (Astrocytes cells): DAPI (Blue), GFAP (Red), Pt complex (Green), and Merge channel. (B) Schematic representation of normal cells and cancer cells population distribution from captured micrograph. (C) GFAP negative cells represent cancer cells with intense nuclear uptake. (D) GFAP positive astrocytes displayed cytosolic uptake without nuclear staining. (E) A zoom in micrograph showed Pt complex different intracellular distribution in the co-culture model from 5 cells including 1 HepG2 cell and 4 astrocytes. (F) Pt complex fluorescence analysis at nuclear and cytosol from astrocytes and HepG2 cells. Scale bars = 20 μm. Abbreviations: G2: HepG2 cells; As: Astrocytes; N: nucleus.

