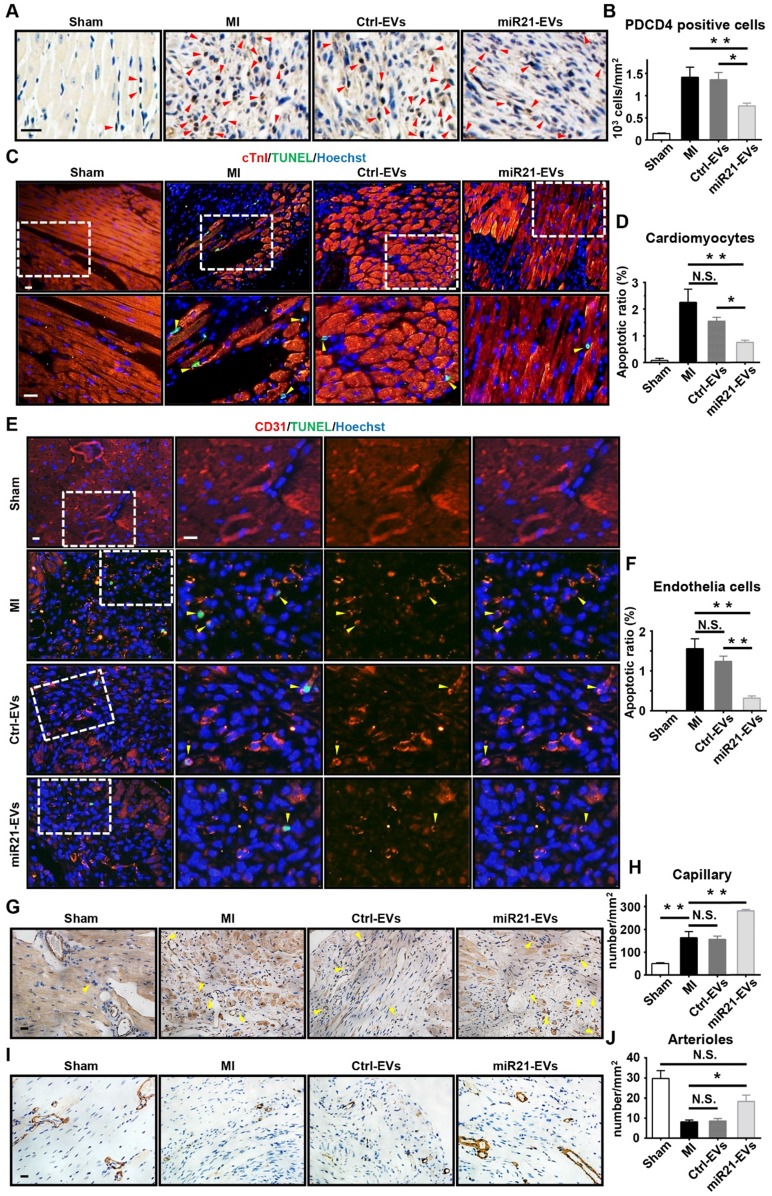
Figure 4.
Effect of miR21-loaded EVs in the mouse infarcted hearts. (A) The representative immunohistochemistry images show PDCD4 positive cells in the infarcted hearts of the animals of sham group, MI group or EVs-injected groups 1 week after MI. The PDCD4 positive staining nuclei were indicated by red arrowheads. Scale bars, 20 μm. (B) Quantification of PDCD4 positive cells of the corresponding images of (A) (4 random fields per animal; n = 3, 3, 3, and 4 for sham group, MI group, Ctrl-EVs group, and miR21-EVs group, respectively). (C and E) TUNEL staining 1 week after acute myocardial infarction and EVs injection into the ischemic center zone. The regions boxed with white dashed lines were enlarged in the lower panel (C) or the right panel (E). The nuclei of apoptotic cardiomyocytes (C) or endothelial cells (E) were indicated by yellow arrowheads. Scale bar, 20 μm. (D and F) Quantification of cTnI+TUNEL+ cardiomyocytes (D) or CD31+TUNEL+ endothelial cells (F) of the corresponding images in (C) or (E), respectively (4 random fields per animal; n = 3, 3, 3, and 4 for sham group, MI group, Ctrl-EVs group, and miR21-EVs group, respectively). (G and I) The representative immunohistochemistry images of CD31 positively stained capillaries (G) at the border zone or SMA positively stained arterioles (I) in the infarct area at week 4 after MI. For sham group, the image of left ventricular were selected. The capillaries (G) were indicated by yellow arrowheads. Scale bar, 20 μm. (H and J) Quantification of capillary density (H) or arteriole density (J) of the corresponding images of (G) or (I), respectively (3 random fields per animal; n = 3, 5, 4, and 5 for sham group, MI group, Ctrl-EVs group, and miR21-EVs group, respectively). Data shown as mean ± SEM. *, p < 0.05, **, p < 0.01, N.S., no significant.

