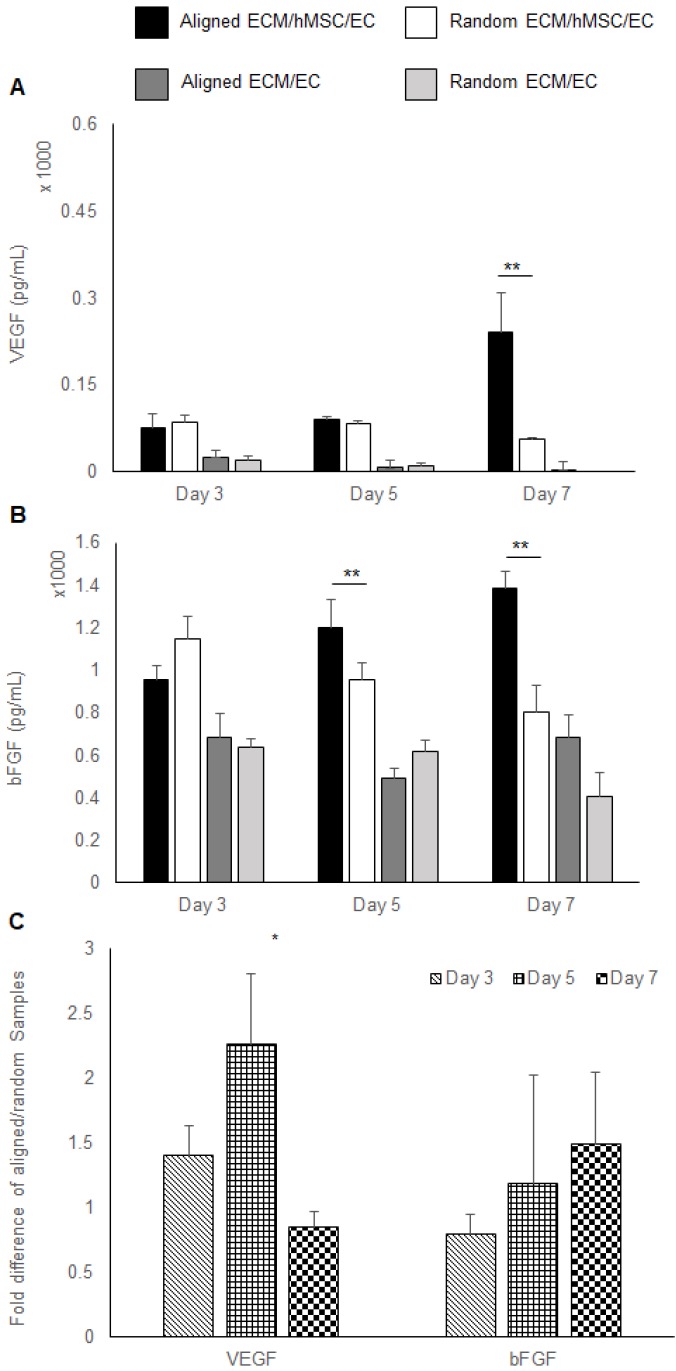
Figure 3.
Pro-angiogenic growth factors expression. (A) VEGF and (B) bFGF localized in the constructs assessed by ELISA. (C) The mRNA expression of VEGF and bFGF was measured by qRT-PCR. The aligned ECM/hMSC/EC has significantly more localized VEGF (day 7) and bFGF (day 5 and day 7) than the random ECM/MSC/EC group. (*p < 0.05, **p < 0.01)

