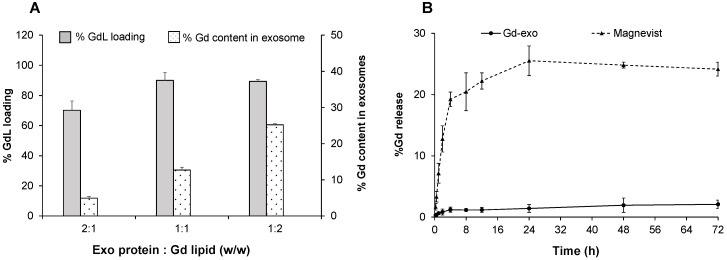
Figure 3.
Gadolinium loading and release studies. (A) Gadolinium (Gd) loading efficiency with different initial input concentrations of Gadolinium lipid (GdL) that correspond to 500 (2:1), 1000 (1:1) and 2000 μg/mL (1:2). Note that maximum GdL labeling occurred at 1:1 ratio. (B) The time-dependent release of Gd from Magnevist® (triangles at top) or GdL-labeled exosomes (Exo-GdL, diamonds at bottom) in physiological conditions (pH: 7.4, 37 ºC). Note that Exo-GdL was more stable and released less than 3% of Gd over 72 h, compared to Magnevist, which released 20% of Gd by 8 h. Gd concentration was quantified by ICP-MS. Data presented are averages ± one standard deviation, n = 3.

