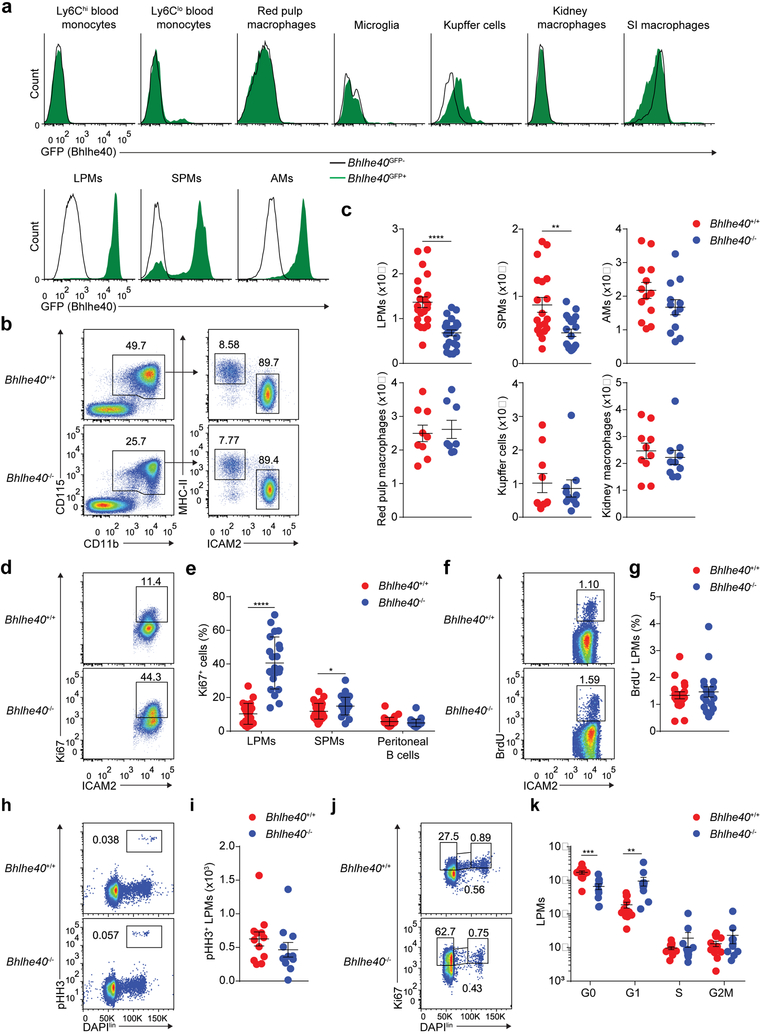
Figure 1. Loss of Bhlhe40 dysregulates the cell cycle in LPMs.
a, Flow cytometry of Bhlhe40GFP transgene reporter expression in blood monocytes (representative of 2 experiments, n=5 Bhlhe40GFP+, 2 Bhlhe40GFP-); red pulp macrophages, microglia, Kupffer cells, kidney macrophages, SI macrophages, and peritoneal macrophages (representative of 2 experiments, n=4 Bhlhe40GFP+, 2 Bhlhe40GFP-); and AMs (representative of 3 experiments, n=6 Bhlhe40GFP+, 3 Bhlhe40GFP-) from Bhlhe40GFP+ and Bhlhe40GFP- mice. b, Flow cytometry of peritoneal macrophage subsets in Bhlhe40+/+ and Bhlhe40−/− mice (representative of 6 experiments, n=22/group). c, Numbers of LPMs as in b, SPMs (pooled from 5 experiments, n=19/group), AMs (pooled from 4 experiments, n=13 Bhlhe40+/+, 12 Bhlhe40−/−), red pulp macrophages (pooled from 3 experiments, n=9 Bhlhe40+/+, 8 Bhlhe40−/−), Kupffer cells, and kidney macrophages (both pooled from 2 experiments, n=10/group) from Bhlhe40+/+ and Bhlhe40−/− mice. d, Flow cytometry of Ki67 expression by Bhlhe40+/+ and Bhlhe40−/− LPMs (representative of 7 experiments, n=24 Bhlhe40+/+, 22 Bhlhe40−/−). e, Frequency of Ki67+ LPMs as in d, SPMs, and B cells (both pooled from 8 experiments, n=30 Bhlhe40+/+, 29 Bhlhe40−/−) from Bhlhe40+/+ and Bhlhe40−/− mice. f, Flow cytometry of BrdU incorporation by Bhlhe40+/+ and Bhlhe40−/− LPMs (representative of 5 experiments, n=18/group). g, Frequency of BrdU+ LPMs as in f. h, Flow cytometry of pHH3 expression by Bhlhe40+/+ and Bhlhe40−/− LPMs (representative of 4 experiments, n=12 Bhlhe40+/+, 11 Bhlhe40−/−). i, Frequency of pHH3+ LPMs as in h. j, Flow cytometry for discrimination of cell cycle phases of Bhlhe40+/+ and Bhlhe40−/− LPMs (representative of 4 experiments, n=12 Bhlhe40+/+, 11 Bhlhe40−/−). k, Numbers of LPMs in each phase of the cell cycle as in j. Data in c,e,g,i,k are mean ± s.e.m; each symbol represents an individual mouse (c,e,g,i,k). *P ≤ 0.05; **P < 0.01; ***P < 0.001; ****P < 0.0001, unpaired two-sided Student’s t-test.

