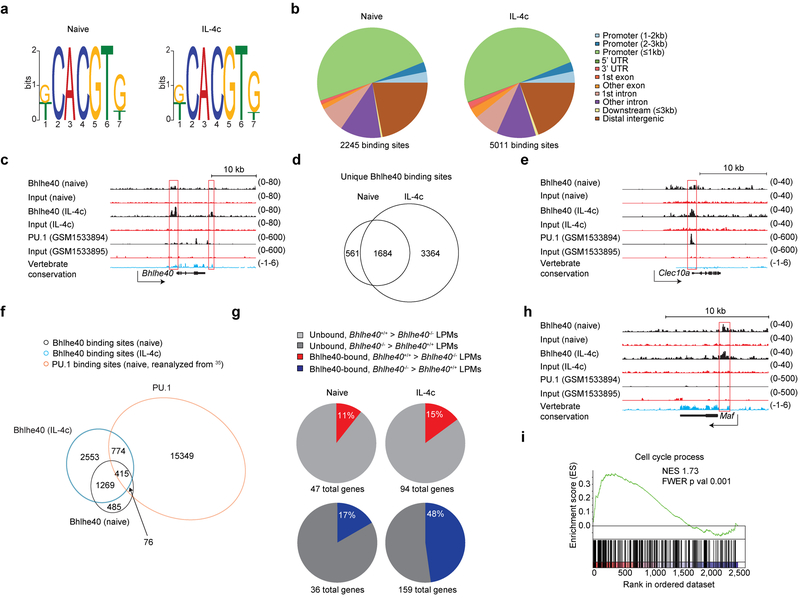
Figure 8. Bhlhe40 directly regulates gene expression in LPMs in an activation state-dependent manner.
a, Bhlhe40 ChIP-seq data were analyzed for consensus binding motifs in LPMs from naive (left) and IL-4c-treated mice (right). b, Bhlhe40 ChIP-seq data were analyzed for locations of Bhlhe40 peaks in the genome in LPMs from naive (left) and IL-4c-treated mice (right). UTR, untranslated region. c, Tracings of Bhlhe40 binding, PU.1 binding, and vertebrate conservation at the Bhlhe40 locus. d, Bhlhe40 ChIP-seq data were analyzed for shared and unique Bhlhe40 binding sites in LPMs from naive and IL-4c-treated mice (depicted as a Venn diagram). e, Tracings of Bhlhe40 binding, PU.1 binding, and vertebrate conservation at the Clec10a locus. f, Naïve LPM Bhlhe40 ChIP-seq data, in vivo IL-4c-stimulated LPM Bhlhe40 ChIP-seq data, and naïve LPM PU.1 ChIP-seq data were analyzed for shared and unique Bhlhe40 and PU.1-bound genes between the three samples (depicted as a Venn diagram). g, The proportion of Bhlhe40-bound, Bhlhe40-dependent genes (≥2-fold differentially expressed in Bhlhe40+/+ and Bhlhe40−/− LPMs) in LPMs from naïve mice and Bhlhe40-bound, Bhlhe40-dependent genes (≥2-fold differentially expressed in Bhlhe40+/+ and Bhlhe40−/− LPMs) in LPMs from IL-4c-treated mice. h, Tracings of Bhlhe40 binding, PU.1 binding, and vertebrate conservation at the Maf locus. i, GSEA of gene expression microarray data for Bhlhe40-bound genes from LPMs from Bhlhe40+/+ and Bhlhe40−/− mice treated with IL-4c for the C5 Cell Cycle Process gene set. NES, normalized enrichment score. FWER, family-wise error rate. LPM Bhlhe40 ChIP-seq data (n=1/group) and microarray data from in vivo IL-4c-stimulated LPMs (n=2/group) are from single separate experiments. LPM PU.1 ChIP-seq data reanalyzed from35. (i) NES and FWER.

