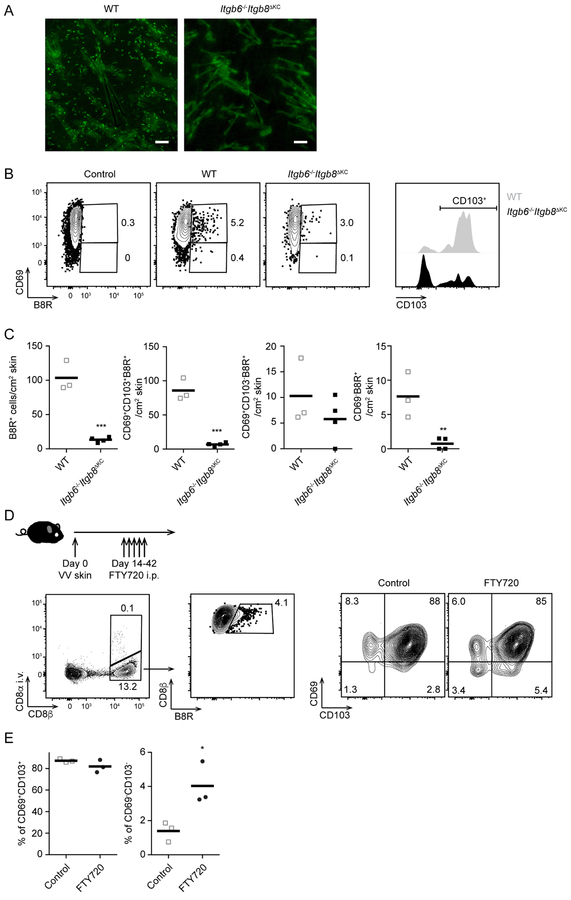
Figure 1. Trm cells and recirculating CD8+ T cells are decreased in the skin of Itgb6−/−Itgb8ΔKC mice after skin vaccinia virus (VV)-infection.
(A) Representative epidermal whole mounts from OT-I adoptive transferred WT and Itgb6−/−Itgb8ΔKC mice at day 42 after VV-OVA skin infection stained for OT-I cells (Thy1.1, green). Scale bar=100 μm. (B) VV-infected skin at day 68 post infection were analyzed by flow cytometry. Plots (left panels) are gated on live CD45+CD3+TCRb+CD8+ T cells (WT and Itgb6−/−Itgb8ΔKC) or CD45+CD3+TCRb+CD8− T cells (control), and B8R+ CD69+ (right panel). (C) Total number of B8R+ cells from (B) are shown. (D) Experimental scheme for testing skin recirculating CD8+ T cells in VV-infected skin. Anti-CD8α antibody was intravenously injected to stain intravascular CD8+ T cells before harvesting VV-infected skin for flow cytometric analysis one day after the last treatment of FTY720. Flow plots gated on live CD90+ T cells (left panel), i.v. CD8α−CD8β+ (middle panel), and B8R+ cells (right panels). (E) The frequency of i.v. CD8α−B8R+ gated cells in the skin are shown. Data are representative of two independent experiments. Each dot represents an individual mouse. Flow cytometry plots are shown as concatenations for all mice in each group within the same experiment. *p < 0.05, **p < 0.01, and ***p < 0.001. See also Figure S1.

