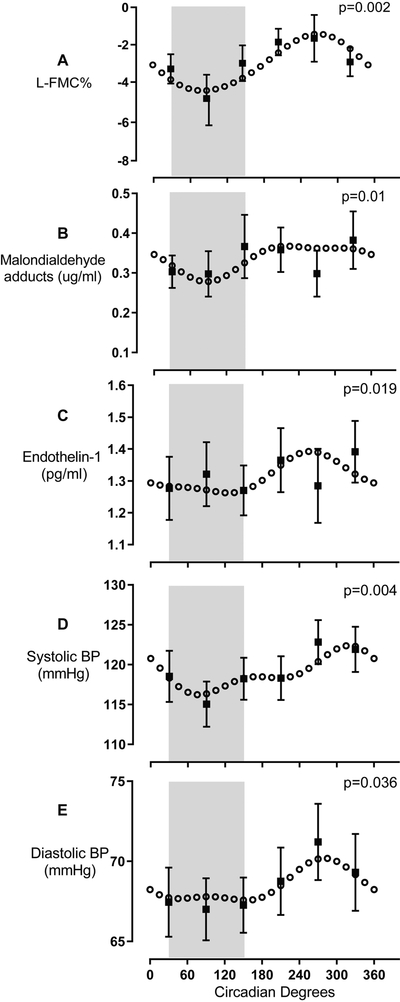
Figure 3. Sinusoidal variation in L-FMC, MDA, ET-1, SBP and DBP.
L-FMC (n = 14, panel A) displays a sinusoidal profile with a trough during the subjective night and a peak in the afternoon. Plasma levels of MDA (n = 16, panel B) and ET-1 (n = 16, panel C) displays sinusoidal variation with a trough during the subjective night and a peak around noon. Systolic BP (n = 21, panel D) and diastolic BP (n = 21, panel E) are rhythmic and sinusoidal with a trough during the biological night and a peak in the evening. Grey shaded area represents habitual sleep time (~11 PM- ~7 AM) in our participants. Circadian model is plotted from the cosinor analyses. Raw observed values are binned by circadian phase within subject and then averaged within group, and plotted as mean ± SEM.

