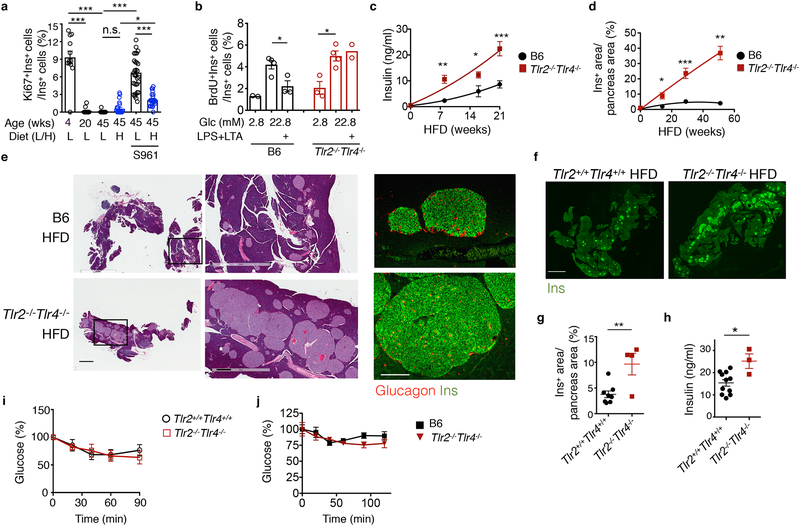
Figure 1. The loss of TLR2 and TLR4 leads to β cell accumulation and hyperinsulinemia in mice on HFD.
a, Flow cytometry analysis of Ki67+ β cells in 4-, 20- or 45-week-old B6 mice fed a LFD (L) or HFD (H, started at 6 weeks of age) for 39 weeks, with or without the insulin receptor antagonist S961 for the last 2 weeks. From left to right, n=12, 13, 16, 23, 32, 26 islets from n=3, 4, 3, 4, 5, 4 mice. b, Flow cytometric analysis showing the percent of BrdU+Ins+ β cells in total Ins+ cells in primary B6 and Tlr2−/−Tlr4−/− islets cultured in 2.8 mM (low) or 22.8 mM (high) glucose for 72 hr, with or without LPS+LTA for the last 48 hr. n=9 mice pooled for each genotype. c, ELISA showing serum insulin levels of B6 and Tlr2−/−Tlr4−/− mice on HFD for 0, 8, 16 and 21-week starting at 6 weeks of age, after a 5-hr fast. Left to right, n=6, 4, 4, 8 (B6) or 8, 3, 4, 9 mice (Tlr2−/−Tlr4−/−). d, Quantitation of Ins+ area/pancreas area in B6 and Tlr2−/−Tlr4−/− islets from mice on HFD for 0, 14, 29 and 51 weeks starting at 6 weeks of age, based on immunohistochemical staining of Insulin. Left to right, n=3, 5, 7, 3 (B6) and 3, 6, 3, 3 mice (Tlr2−/−Tlr4−/−). e, Representative H&E and confocal images showing pancreatic sections (left-middle) and Insulin (Ins)-Glucagon staining of B6 and Tlr2−/−Tlr4−/− mice on HFD for 51 weeks. Scale bars, 2 mm (left), 0.5 mm (middle) and 0.2 mm (right). Representative data from 3 mice each. f-g, Representative confocal images showing Ins+ pancreatic areas in Tlr2+/+Tlr4+/+ and Tlr2−/−Tlr4−/− littermates on 20-week HFD (f), with quantitation of Ins+ areas normalized to total pancreas area shown in (g). Scale bars, 2 mm. n=8 and 4 mice (Tlr2+/+Tlr4+/+ and Tlr2−/−Tlr4−/−). (h) ELISA showing serum insulin levels of Tlr2+/+Tlr4+/+ and Tlr2−/−Tlr4−/− littermates on 20-week HFD. n=11 (Tlr2+/+Tlr4+/+) and 3 mice (Tlr2−/−Tlr4−/−). i-j, Insulin tolerance test showing changes in blood glucose levels in Tlr2+/+Tlr4+/+ and Tlr2−/−Tlr4−/− littermates (i) and B6 and Tlr2−/−Tlr4−/− mice (j) on 14-week HFD. n=12 mice each (i); n=6 (Tlr2+/+Tlr4+/+) and 3 mice (Tlr2−/−Tlr4−/−) (j). Values represent mean ± SEM. All the data were reproducible with at least two repeats. n.s., not significant; *, p<0.05; **, p<0.01; and ***, p<0.001, using a one-way ANOVA with Newman-Keuls post-test (a) or unpaired two-tailed Student’s t test (b-d, g-j).

