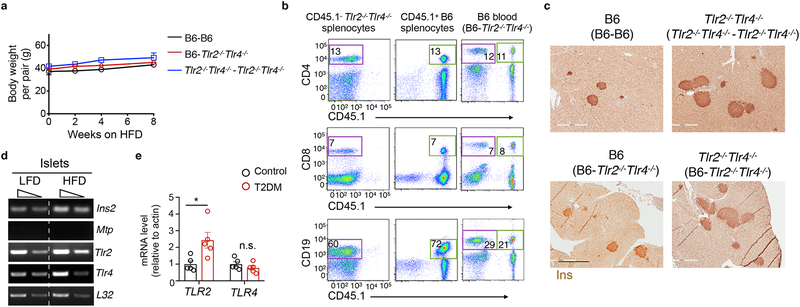
Figure 5. The effect of TLR2 and TLR4 on HFD-induced β cell proliferation is independent of circulating factors.
a, body weight gain of parabiotic pairs on a HFD following the surgery and 3-week recovery. b, flow cytometric plots showing the equilibration of CD4+ T cells, CD8+ T cells and CD19+ B cells in the blood of the CD45.1+ B6 - CD45.1− Tlr2−/−Tlr4−/− parabiotic pairs 3 weeks post-surgery (prior to HFD feeding). Splenocytes from unpaired B6 or Tlr2−/−Tlr4−/− mice were used as controls (left two columns). Number refers to the percent of gated cells in total lymphocytes or splenocytes. (c) Representative images of Ins+ β cells in pancreatic sections of parabiotic pairs on 14-week HFD. Scale bars, 0.5 mm. a-c, n=4, 4, 6 mice for B6-B6, Tlr2−/−Tlr4−/− -Tlr2−/−Tlr4−/− pair, and B6-Tlr2−/−Tlr4−/− pairs. d, RT-PCR analysis showing Tlr2 and Tlr4 expression in islets from B6 mice fed on a LFD or 7-month HFD. Triangles represent a 4-fold dilution of cDNA samples. Islets pooled from 4 mice. Two controls: Mtp, Microsomal triglyceride transfer protein; Ins2, Insulin 2. The gel was cropped to show relevant bands. e, qPCR analysis of TLR2 and TLR4 expression in human T2D islets vs. healthy islets (n=5 individuals each). Values represent mean ± SEM. n.s., not significant; *, p=0.022 by two-tailed Student’s t test.

