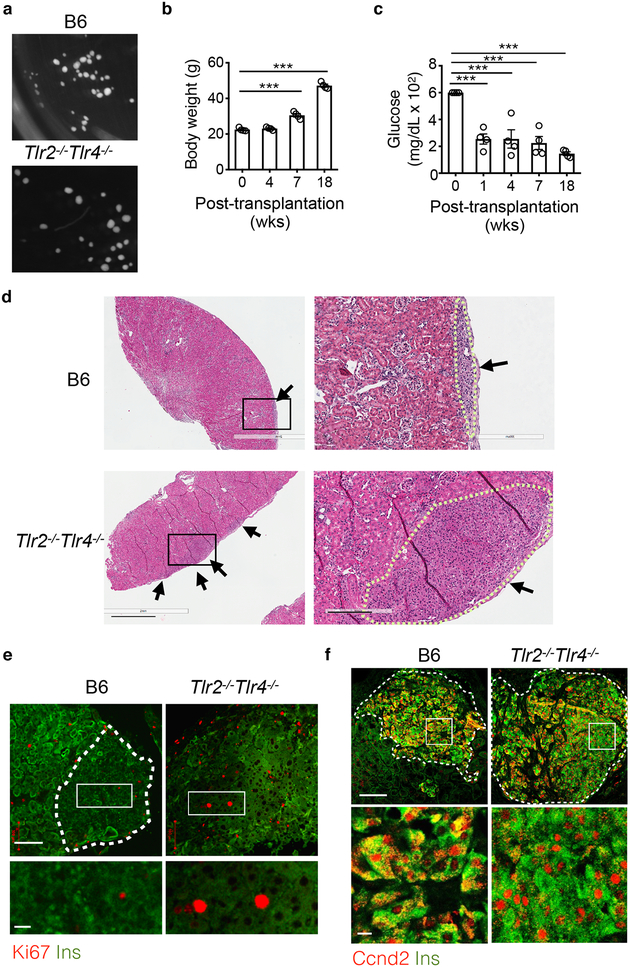
Figure 6. The effect of TLR2 and TLR4 on HFD-induced β cell proliferation is islet intrinsic.
a, Representative light microscopic images showing the size of primary islets from age-matched Tlr2−/−Tlr4−/− and B6 mice on LFD used for transplantation under the kidney capsule. 100 B6 and 100 Tlr2−/−Tlr4−/− primary islets were transplanted under the left and right kidney capsules of the same recipient, either B6 or Tlr2−/−Tlr4−/−, respectively. b-c, Body weight (b) and blood glucose (c) of B6 recipients post-transplantation. The same trends were observed for Tlr2−/−Tlr4−/− recipients (n=4; not shown). d, Representative H&E images showing islets (arrows) from recipient kidneys received islet grafts from B6 (upper) or Tlr2−/−Tlr4−/− (lower) mice. The dotted line outlines the boundary of the islet grafts. Scale bars, 1 mm (left) and 0.2 mm (right). e,f, Representative confocal images showing Ki67+Ins+ cells (e) or Ccnd2+Ins+ (f) of transplanted islets under kidney capsules. Scale bars, 100 μm (upper) and 20 μm (lower inset). The dotted line marks the boundary of the islets (note high auto-fluorescent signals of the surrounding kidney tubules); for Tlr2−/−Tlr4−/− islets, the whole field is full of β cells (e). Representative image from 4 mice each with two repeats. Values represent mean ± SEM. ***, p<0.001 by two-tailed Student’s t-test (b-c), each compared to day 0.

