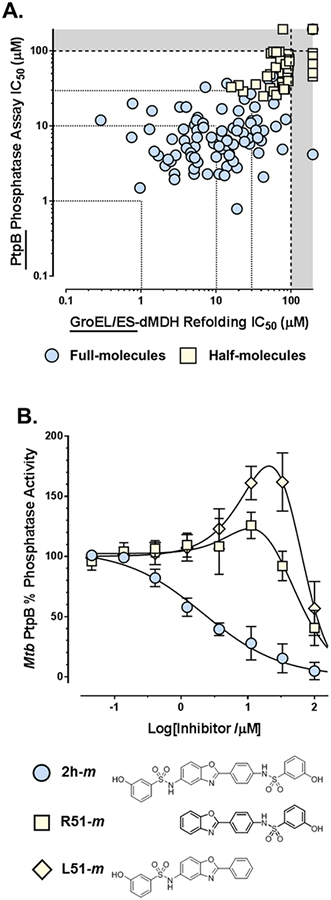
Figure 5.
A. Correlation plot of IC50 values for compounds tested in the GroEL/ES-dMDH refolding and M. tuberculosis PtpB phosphatase assays (Spearman correlation coefficient is 0.756, p < 0.0001). B. Dose-response curves for analogs 2h-m, R51-m, and L51-m evaluated in the M. tuberculosis PtpB phosphatase assay. While the full-molecules all inhibit M. tuberculosis PtpB phosphatase activity with increasing compounds concentrations, most half-molecules exhibit a bi-phasic response where compounds activate then inhibit phosphatase activity, to varying extents, as shown for analogs R51-m and L51-m. Data point errors represent standard deviations from 6–8 replicates.

