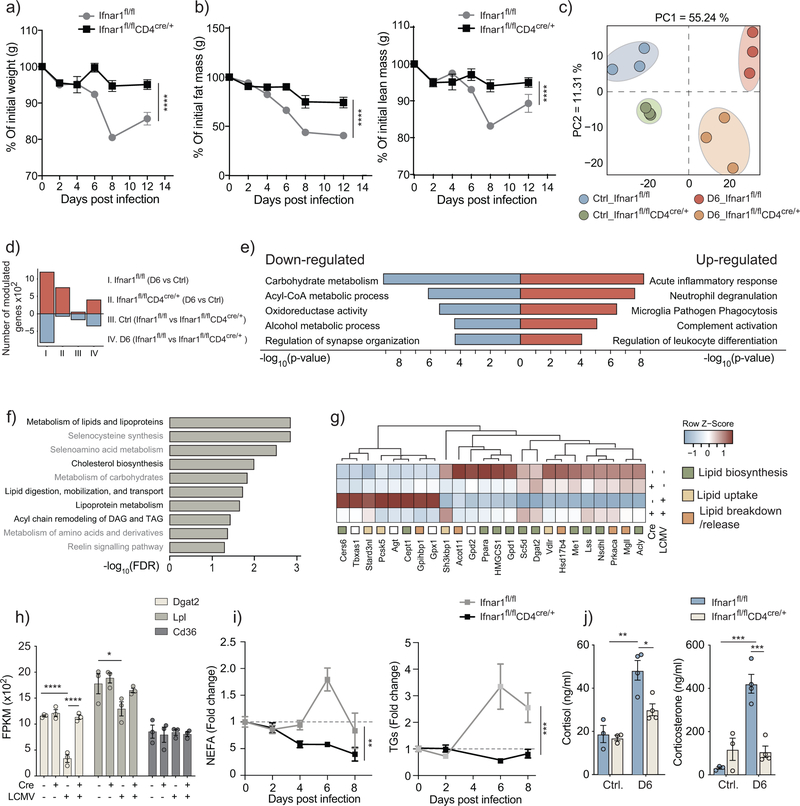
Figure 4: CD8 T cells modulate adipose tissue lipid metabolism in a type I IFN-dependent manner.
Analysis of Ifnar1fl/flCD4cre/+ mice compared to Ifnar1fl/fl controls. a) Body weight kinetics of LCMV-infected mice (n=4) (p-values: ****< 0.0001 two-way ANOVA). Data are representative of four independent experiments and show mean ± s.e.m. b) Body composition as measured using EchoMRI in live un-anesthetized LCMV-infected mice (n=4) (p-values: ****< 0.0001 two-way ANOVA). Data are representative of a single experiment and show mean ± s.e.m. c-h) RNA-seq analysis of inguinal fat pads of LCMV-infected and uninfected Ifnar1fl/flCD4cre/+ mice compared to Ifnar1fl/fl controls at 6 days post-infection (n=3). Data shows principal component analysis (PCA) (c), number of modulated genes (d), and significantly modulated genes (<0.05 Adjusted p-value, log fold change > 0.7 or < −0.7) in the limma implementation of 2×2 factorial interaction model. Top five enriched ClueGo pathways for up- and down-regulated genes (e). Enrichment of top 10 modulated metabolic pathways (f). Heatmap of the top modulated genes involved in lipid biosynthesis, uptake, or breakdown and release (g). RNA expression of Cd36, Lpl, and Dgat2 (h) (p-values: **** < 0.0001, *0.015 two-way ANOVA, Bonferroni correction). i) Serum triglyceride and non-esterified fatty acid levels (n=4) (p-values: **0.0027, ***0.0004 two-way ANOVA). j) Circulating levels of cortisol and corticosterone, as measured by ELISA (n=4) (p-values: **0.0010, *0.0185, ***0.0001, ***0.0004 two-way ANOVA, Bonferroni correction). h-j) data are representative of two independent experiments, and show mean ± s.e.m.

