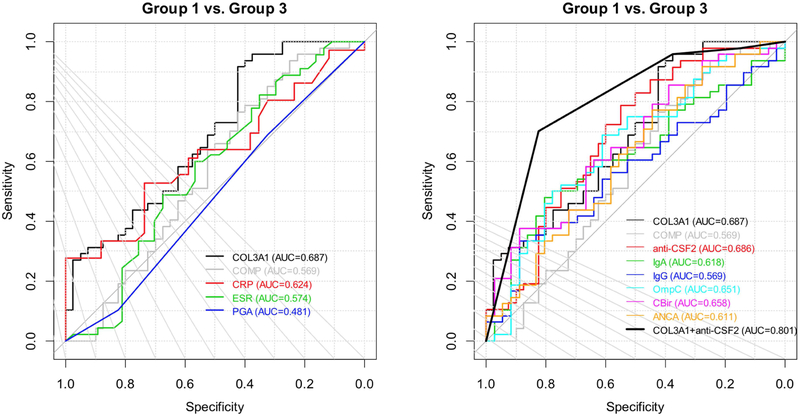
Figure 3: ROC curves of various prediction models. Left panel: comparison of COL3A1 and clinical disease burden variables in prediction of group 1 vs. group 3. Right panel: comparison of prediction models using each serological marker vs. the model with COL3A1 + anti-CSF2.
COL3A1 = collagen type III alpha 1 chain, COMP = cartilage oligomeric matrix protein, PGA = Physician Global Assessment, ESR = erythrocyte sedimentation rate, CRP = C-reactive protein, anti-CSF2 = colony stimulating factor 2 antibodies, ASCA = anti-Saccharomyces cerevisiae antibodies, OmpC = anti-outer membrane protein C precursor, CBir = anti-flagellin, ANCA = perinuclear anti-neutrophil cytoplasmic antibodies

