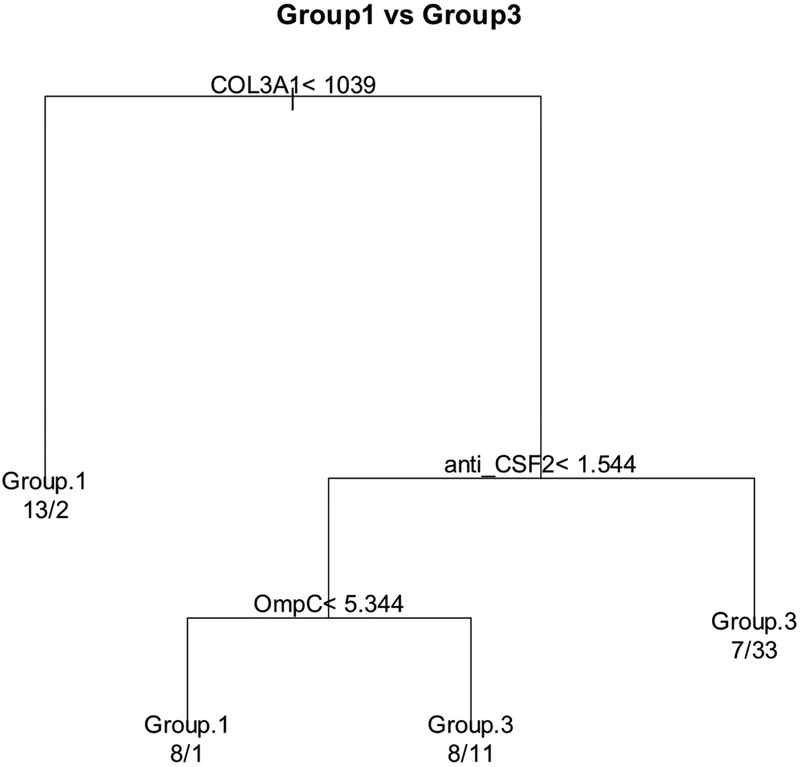
Figure 4. Prediction model using classification and regression tree (CART) method.
If a patient is evaluated as True for the condition at each level, s/he will be passed to the left side of the split, otherwise to the right side of the split. At the end of each branch, the group membership listed is the prediction label (predicted class using the criteria specified by that route). The numbers below the prediction label are the number of patients being predicted as the prediction label but actually belong to Group 1 and Group 3 separated by a slash. For example, the far-right route means with COL3A1≥1039 and anti-CSF2 ≥ 1.544, 40 patients were classified as Group 3 but only 33 of them are truly belong to Group 3.

