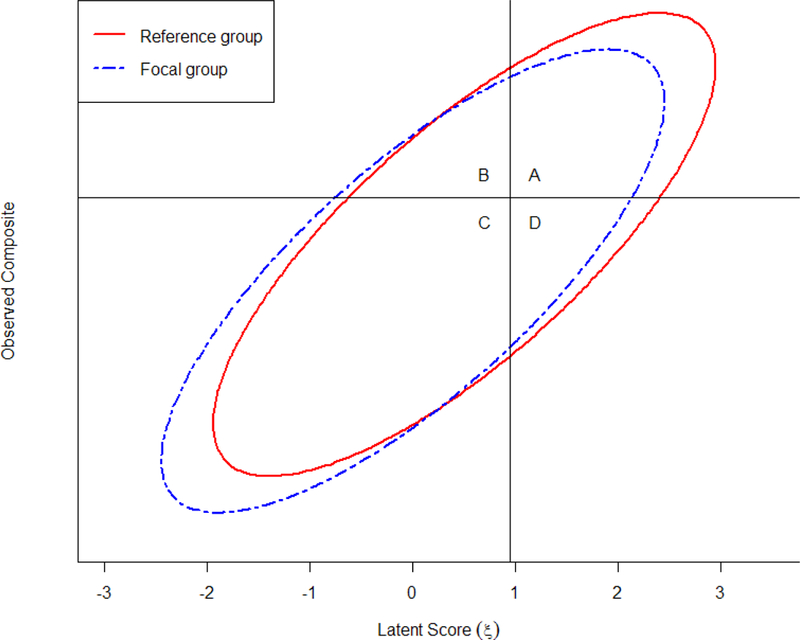
Figure 1.

Recreation of Figure 2 from Millsap and Kwok (2004) showing the bivariate distribution of latent score and observed sum score with respect to two subpopulations. Note that the graph is used mainly for conceptual understanding; when the indicators were binary, the contour is not smooth and continuous.
