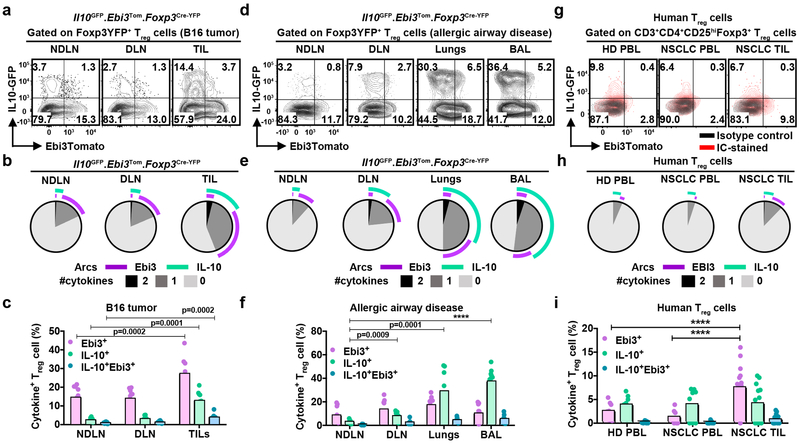
Figure 1: Reciprocal expression of IL-10 and IL-35 on both mouse and human Treg cells.
a, Representative flow plots depicting the expression and distribution of IL-10+ and Ebi3+ cells within Foxp3YFP+ Treg cells, isolated from B16-tumor bearing Il10GFP.Ebi3Tom.Foxp3Cre-YFP mice 14 days post tumor inoculation. The expression of IL-10 (GFP+) and IL-35 (Ebi3-Tomato+) assessed in the non-draining axillary and brachial lymph nodes (NDLN), draining inguinal lymph nodes (DLN) and B16 tumor-infiltrating lymphocytes (TIL).
b, SPICE plots depicting co-expression pattern of IL-10 and Ebi3 on TIL Treg cells as in (a).
c, Scatter-bar plot depicting percent distribution of cytokine single- and double-positive Treg cells as in (a) (n=11 mice). Bars represent mean values. Statistical significance was determined by Two-way ANOVA with Holm-Sidak multiple comparisons (p-values as indicated).
d, Representative flow plots depicting expression and distribution of IL-10+ and Ebi3+ cells within Foxp3-YFP+ Treg cells, isolated from day 14 allergic inflammation induced Il10GFP.Ebi3Tom.Foxp3Cre-YFP mice. NDLN, DLN, Lungs, and Bronchoalveolar lavage fluid (BAL).
e, SPICE plots depicting co-expression pattern of IL-10 and Ebi3 on Treg cells as described in (d).
f, Scatter-bar plot depicting percentage of cytokine single- and double-positive Treg cells as described in (d) (n=12 mice). Bars represent mean values. Statistical significance was determined by Two-way ANOVA with Holm-Sidak multiple comparisons (****p<0.0001 and other p-values as indicated).
g, Representative flow plots depicting the expression and distribution of IL-10 and IL-35 in human Treg cells (CD4+CD25HIFoxp3+) obtained from healthy donor (HD) PBMC (PBL), NSCLC PBL, or NSCLC TILs. Cells were stimulated overnight with plate-bound anti-CD3 and anti-CD28 in the presence of hIL2, followed by four hours of stimulation with PMA-ionomycin prior to surface and intracellular (IC)-staining for IL-10 and IL-35 (EBI3) expression analysis. Isotype control (black) and IC-stained (red) are overlaid. Data representative of three independent experiments.
h, SPICE plots depicting co-expression pattern of IL-10 and EBI3 on Treg cells as described in (g).
i, Scatter-bar graph depicting percent distribution of inhibitory cytokines as in (g). Bars represent mean values HD PBL (n=9), NSCLC PBL (n=9), and NSCLC TIL (n=16). Statistical significance was determined by Two-way ANOVA with Holm-Sidak multiple comparisons (****p<0.0001).

