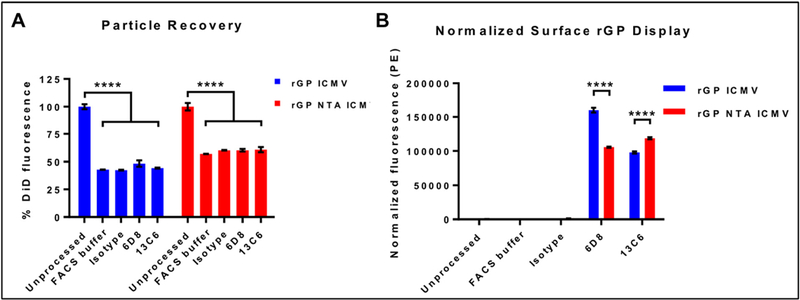
Figure 4. Bulk analysis of rGP display on nanoparticle surfaces.

(A) Particle recovery after immunostaining process by retention of DiD signals in unprocessed and processed nanoparticles. (B) Normalized fluorescence signals of PE-labeled secondary antibodies bound to nanoparticles incubated with the indicated primary antibodies. Measurements reported as mean ± SEM. Statistical analysis performed by two-way ANOVA, followed by Tukey’s multiple comparisons test. ***p < 0.001.
