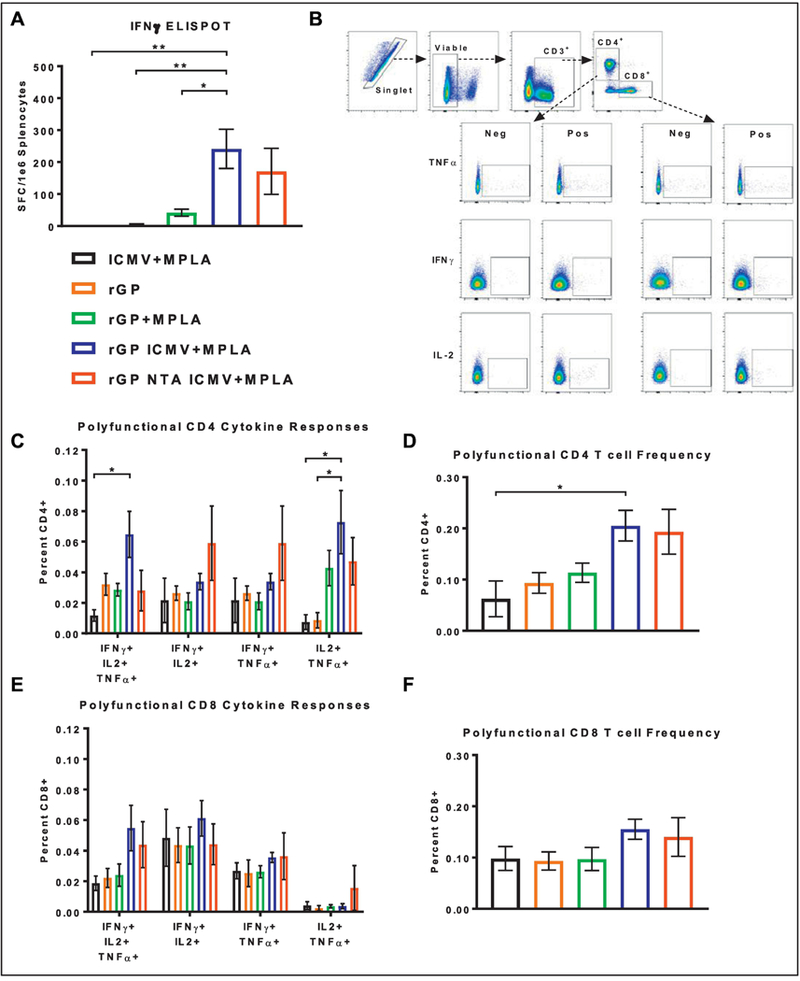
Figure 8. T cell responses in spleens of vaccinated mice.

(A) IFN-γ-producing T cell frequencies from harvested spleens were enumerated by ELISpot. (B) Representative flow cytometry gating of ICS stained CD4+ and CD8+ T cells from vaccinated mice (Pos. columns) and naïve mice (Neg. columns). (C, E) Relative frequency of CD4+ and CD8+ polyfunctional T-cell subsets. (D, F) Relative frequency of combined CD4+ and CD8+ polyfunctional T-cell responses from spleens of vaccinated mice. Measurements reported as mean ± SEM. Statistical analysis performed by one-way (A, D, F) or two-way (C, E) ANOVA, followed by Tukey’s multiple comparisons test. *p < 0.05, **p < 0.01.
