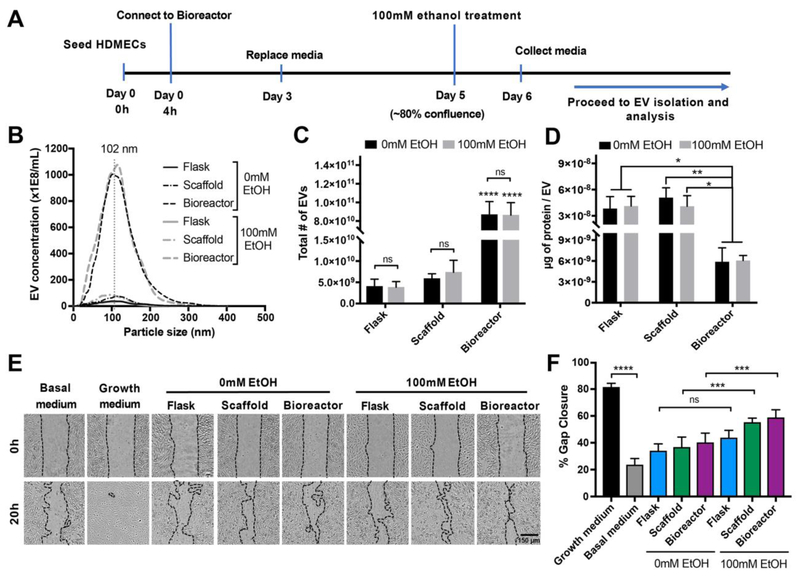
Figure 3. Ethanol conditioning improves EV bioactivity in static and dynamic scaffold cultures.
(A) Schematic of experimental system for integrating ethanol conditioning with perfusion bioreactor culture. (B) Concentration and size distribution, (C) total number of EVs produced, and (D) surface protein content (μg) normalized to total number of EVs derived from HDMECs in Flask, Scaffold, and Bioreactor culture conditions with or without 100 mM ethanol (EtOH) treatment are shown. No statistical differences were observed between ethanol treated and untreated (0 mM EtOH) groups for EV production and protein amount per EV. Statistical significance between total EV production and protein content was detected between Bioreactor and Flask or Scaffold cultures (p<0.0001). (E) HDMECs were stimulated with growth media (EGM2; positive control), basal media (EBM2; negative control), or 200 μg/mL EVs isolated from the three indicated culture conditions with or without 100 mM ethanol conditioning. Representative images captured at 0 and 20 h are shown. (F) ImageJ analysis of cell gap area at 20 h relative to the gap area at 0 h (gap area depicted with black dotted lines). Data and images represent three independent experiments in triplicates each (n=3). A significant increase in EV bioactivity was observed in 100 mM EtOH treated EV groups from Scaffold and Bioreactor (p<0.001), but not from Flask culture (p>0.05). Statistical difference was calculated using two-way ANOVA with Bonferroni’s multiple comparison test (ns-p>0.05, *p<0.05, **p<0.01, ***p<0.001, ****p<0.0001). Scale bar= 150 μm.

