Fig. 5.

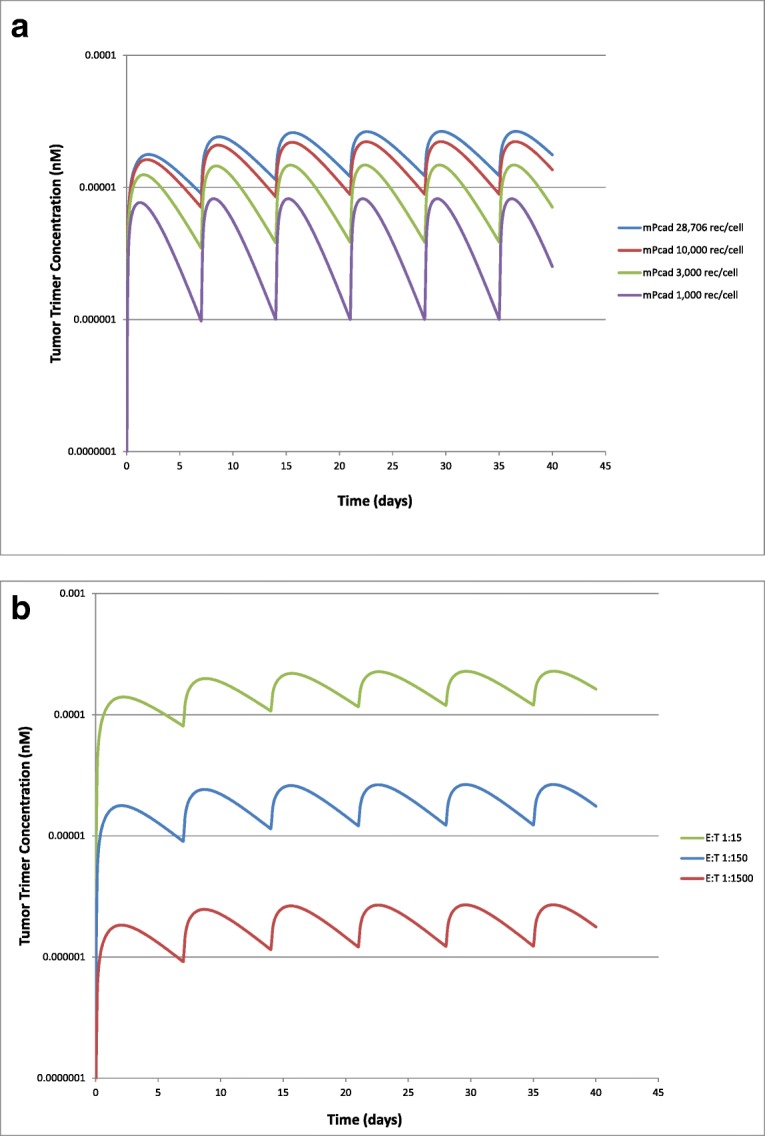
Model simulated tumor trimer concentrations at a different P-cadherin receptor expression values (1000–28,706 receptors/cell) and b different E:T ratios (1:1500–1:15) following IV infusion of PF-06671008 at 0.1 μg/kg QW to cancer patients

Model simulated tumor trimer concentrations at a different P-cadherin receptor expression values (1000–28,706 receptors/cell) and b different E:T ratios (1:1500–1:15) following IV infusion of PF-06671008 at 0.1 μg/kg QW to cancer patients