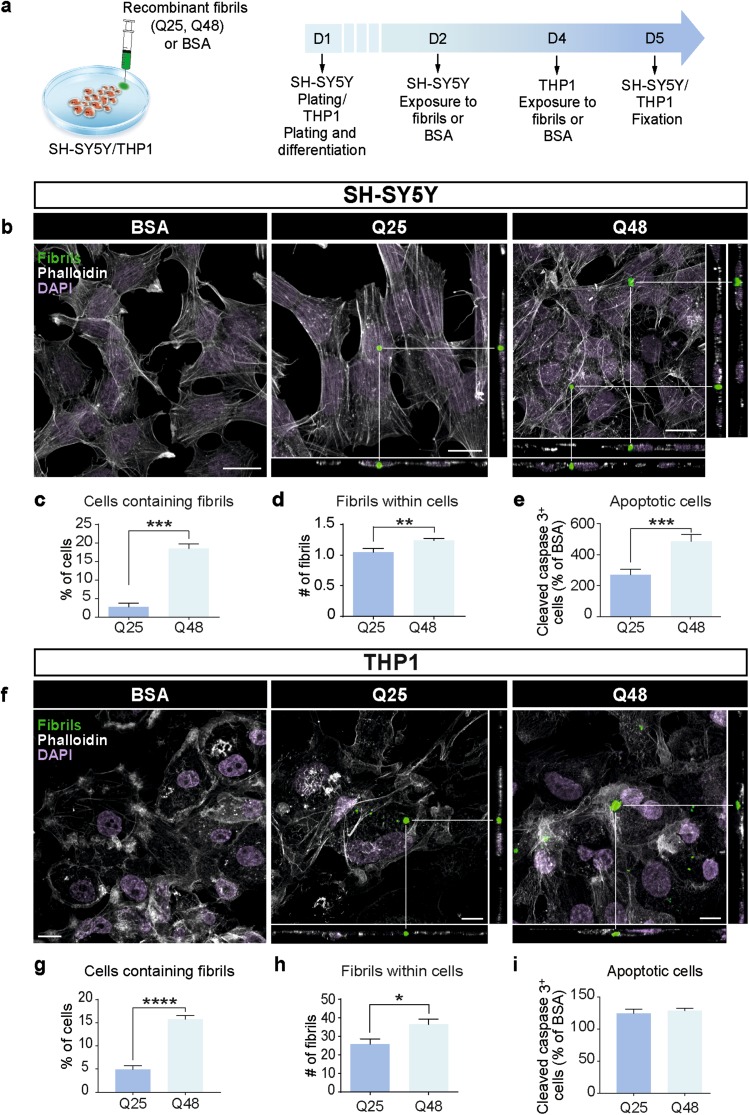
Fig. 1.
Uptake of fibrillar HTTExon1Q25 and Q48 by different cell types. Schematic of experimental design (a). Representative confocal photomicrographs of human SH-SY5Y cells (b) and THP1-derived macrophages (f) demonstrating uptake of both ATTO488-labeled HTTExon1Q25 and Q48 fibrils (green), 72 (SH-SY5Y) and 24 h (THP1) post-exposure, respectively. For all photomicrographs, the cell membrane was labelled with phalloidin (white) and cell nuclei were stained with DAPI (purple). The percentage of SH-SY5Y (c) and THP1 (g) cells containing puncta, the number of puncta per SH-SY5Y (d) and THP1 (h) cell and the number of apoptotic SH-SY5Y (e) and THP1 (i) cells were all calculated. All graphs are the average of three independent experiments. Data are expressed as mean ± SEM. Statistical analysis was performed using a students’ unpaired t test. *p < 0.05, **p < 0.01, ***p < 0.001, ****p < 0.0001. Scale bars b = 25 µm, f = 10 µm. BSA bovine serum albumin

