Fig. 2.
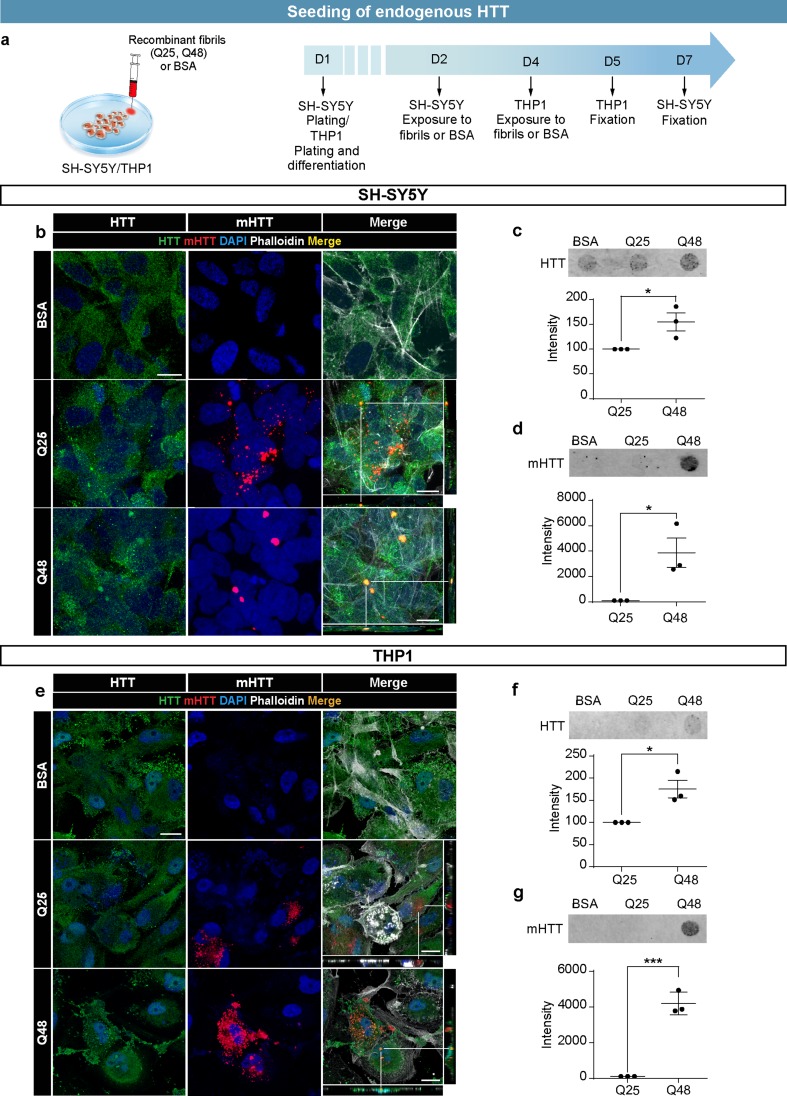
Seeding of endogenous HTT by exogenous HTTExon1Q48 fibrils. Schematic of experimental design for SH-SY5Y cells and THP1-derived macrophages (a). Representative confocal photomicrographs of cells exposed to ATTO550-labeled HTTExon1Q25/Q48 fibrils for 5 days (SH-SY5Y—b) and 24 h (THP1—e). Filter retardation assay and quantification of HTT aggregation immunodetected with anti-WT HTT antibody MAB2166 and anti-aggregated HTT antibody EM48 for SH-SY5Y (c, d) and THP1 (f, g) cells. For all filter retardation assay quantifications, the Q48 intensity is shown as percentage of the intensity of Q25. For immunofluorescence, endogenous HTT was detected with MAB2170 (green), HTTExon1Q25 and Q48 (red) and cell nuclei were stained with DAPI (blue). All graphs are the average of three independent experiments. Data are expressed as mean ± SEM. Statistical analysis was performed using a students’ unpaired t test (f). *p < 0.05, ***p < 0.001. Scale bars = 10 µm. GFP green fluorescent protein, HTT huntingtin, BSA bovine serum albumin

