Fig. 4.
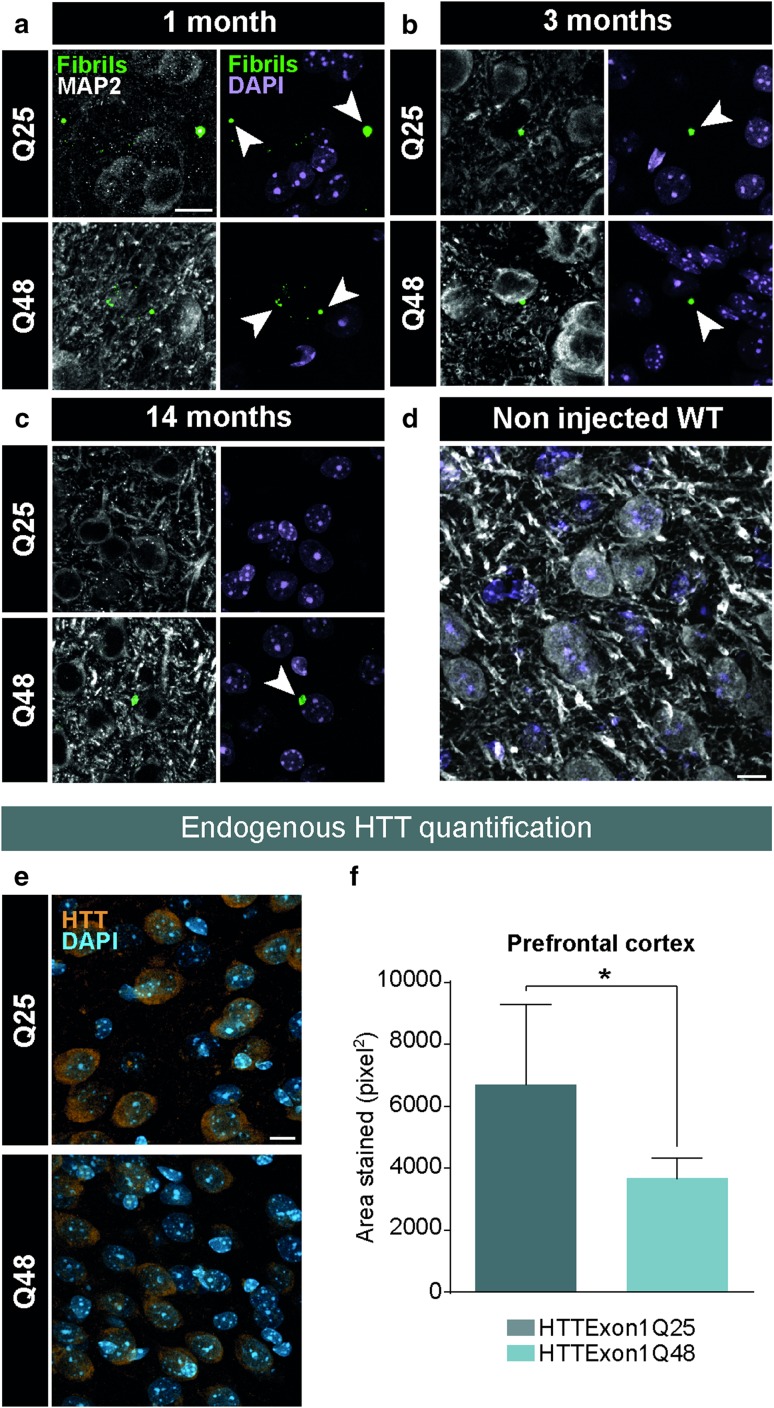
Post-mortem identification of HTTExon1Q25 and Q48 fibrils in adult WT mice. Representative confocal photomicrographs of brain tissue of WT mice sacrificed 1 month (HTTExon1Q25 n = 2, HTTExon1Q48 n = 2) (a), 3 months (HTTExon1Q25 n = 2, HTTExon1Q48 n = 2) (b) and 14 months (HTTExon1Q25 n = 8, HTTExon1Q48 n = 8) post-injection and immunostained for HTTExon1 (green) and MAP2 (white). Arrowheads indicate the localization of fibrils. Specificity of anti-HTTExon1 antibody was assessed by staining a non injected WT mouse (d). Representative confocal photomicrographs of brain tissue of WT sacrificed at 14 months post-surgery and immunostained for endogenous HTT (orange) (e). Quantification of HTT intensity as measured by total area stained in the prefrontal cortex (f). Nuclei were detected with DAPI (purple a–d; blue e). Data are expressed as mean ± SEM. WT Q25 n = 7, WT Q48 n = 7. Statistical analysis was performed using a students’ unpaired t test. *p < 0.05. Scale bars = 10 µm. MAP2 microtubule-associated protein 2, WT wild type. Arrowheads indicate the localization of fibrils

