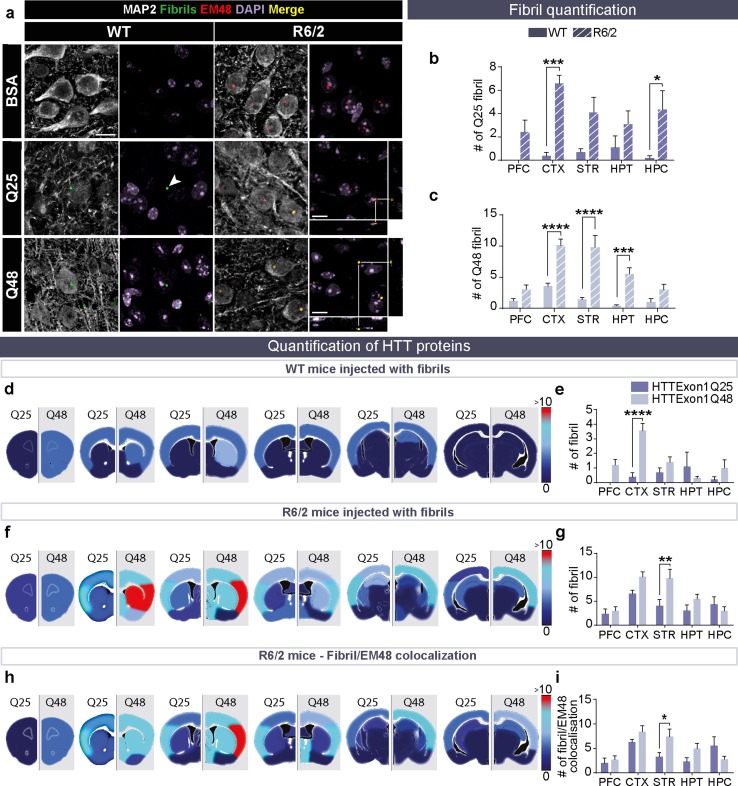
Fig. 6.
Colocalization of HTTExon1Q48 fibrils and endogenous mHTT in R6/2 mice. Representative confocal photomicrographs of fibrils in the brains of WT and R6/2 mice at 12 weeks post-injection (a). Arrowheads indicate the localization of fibrils. BSA-injected mice were used as negative controls to set the lasers on the confocal microscope. Direct comparison of puncta number between WT and R6/2 mice injected HTTExon1Q25 (b) and HTTExon1Q48 (c). Heat maps depicting the number of puncta detected in different brain regions by converting low numbers of puncta to dark blue, and high numbers to red, in WT (d) and R6/2 mice (f). The corresponding graphs are displayed for WT (e) and R6/2 mice (g). The colocalization between EM48 and HTT fibrils depicted as a heat map (h) and graph (i). Quadruple immunofluorescence of injected fibrils (green), endogenous aggregates EM48 (red), microtubule-associated protein MAP2 (white) and cell nuclei DAPI (purple). Scale bars = 10 µm. Data are expressed as mean ± SEM. WT HTTExon1Q25 n = 5, WT HTTExon1Q48 n = 5, R6/2 HTTExon1Q25 n = 5, R6/2 HTTExon1Q48 n = 5. Statistics are performed using a two-way ANOVA with Tukey’s post hoc tests. *p < 0.05, **p < 0.01, ***p < 0.001, ****p < 0.0001. BSA bovine serum albumin, CTX cortex, HPC hippocampus, HPT hypothalamus, MAP2 microtubule associated protein, PFC prefrontal cortex, STR striatum, WT wild type

