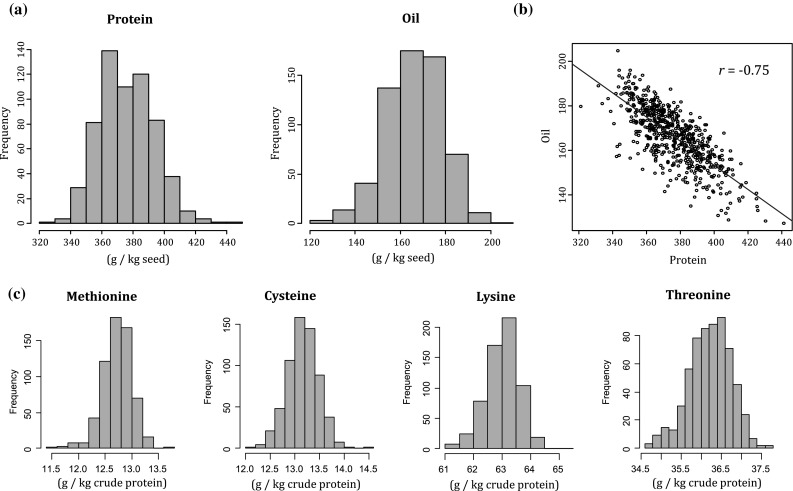
Fig. 1.

Phenotypic distribution of seed protein and oil contents (a) by scaled best linear unbiased predictor (BLUP) values across all environments (ALL) among the 621 plant introductions and their correlation (P < 0.0001) (b). Phenotypic distribution of amino acids by scaled BLUP values across all environments was also shown (c)
