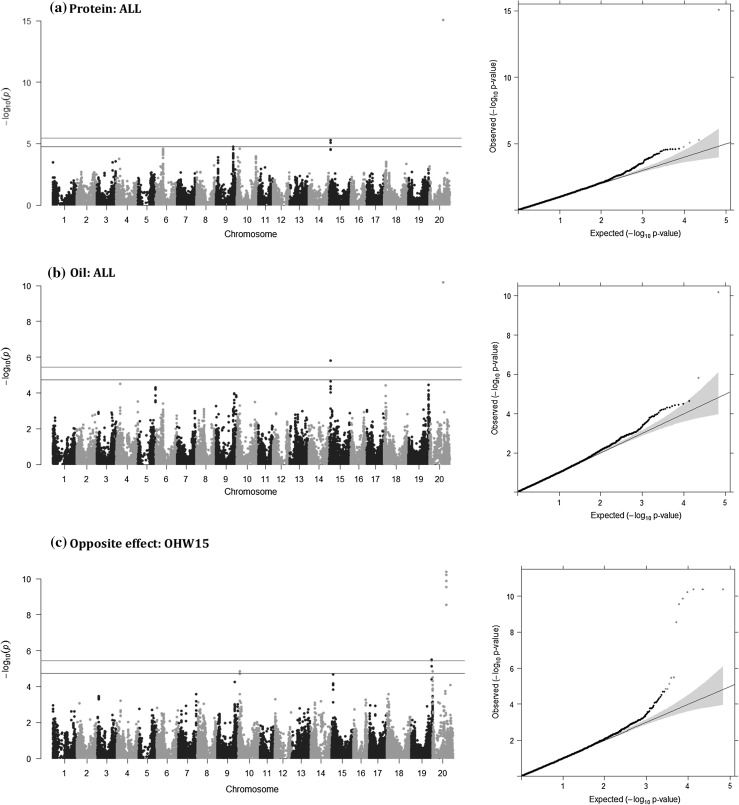
Fig. 3.
Manhattan plots (left) and QQ-plots (right) for GWAS of the 621 soybean accessions for protein (a) and oil (b) contents using multi-locus mixed model and opposite effect (c) by multi-trait mixed model. The trait associations for 34,014 SNPs were plotted by all environments combined (ALL) (a and b) or the Wooster, Ohio 2015 environment (OHW15) (c). Red and blue horizontal lines in the Manhattan plots and markers in the QQ-plots represent the genome-wide significant threshold (5%) and suggestive significance thresholds (25%), respectively, and the SNPs significantly associated at those levels. Shaded regions of the QQ-plots represent a 95% confidence interval (color figure online)

